Reversal Signals
- Indicadores
-
Makarii Gubaydullin
 Assistente de Negociação Multifuncional
MT5: https://www.mql5.com/pt/market/product/71145 - Versão: 1.10
- Atualizado: 31 março 2022
- Ativações: 5
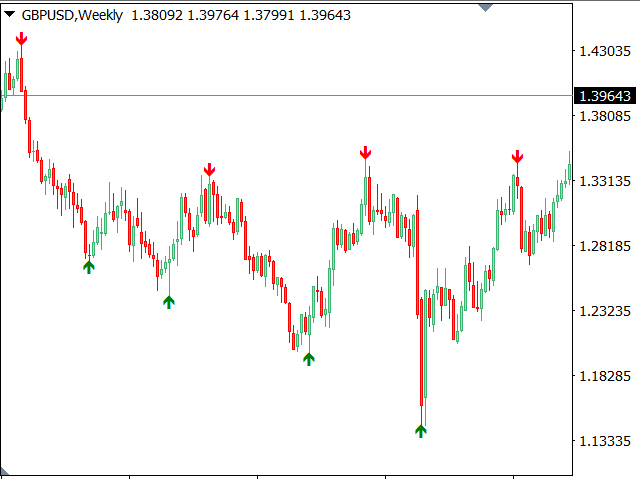
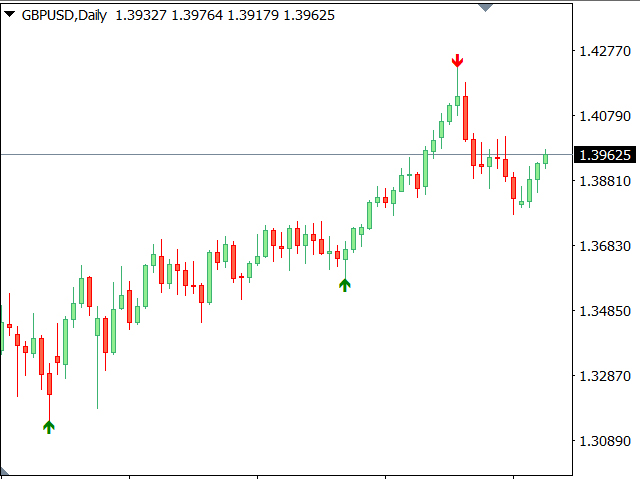
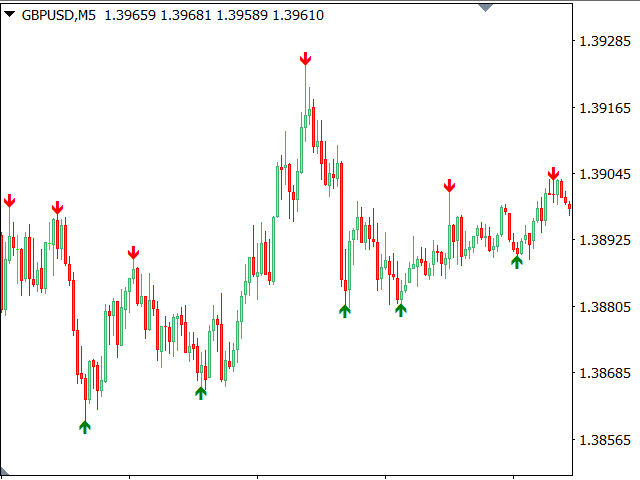
Indicador multimoeda de sinais de reversão
Confira Meu #1 Assistente de trading: inclui 66+ recursos e indicadores | Entre em contato se tiver dúvidas
- Os sinais são calculados com base em níveis de sobrevenda e sobrecompra.
- O indicador funciona com qualquer instrumento de trading e em qualquer timeframe.
- Os sinais são filtrados adicionalmente por indicadores de tendência.
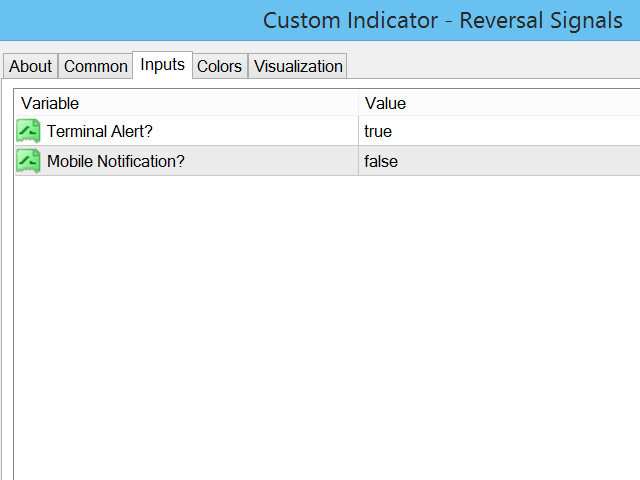
- As cores das setas podem ser ajustadas nas configurações de entrada.
- Opções de notificação: alertas no terminal e notificações push no dispositivo móvel.