Reversal Signals
- 지표
- 버전: 1.10
- 업데이트됨: 31 3월 2022
- 활성화: 5

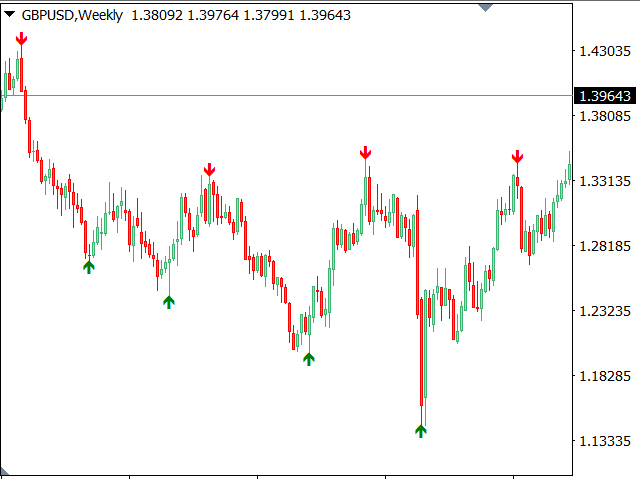
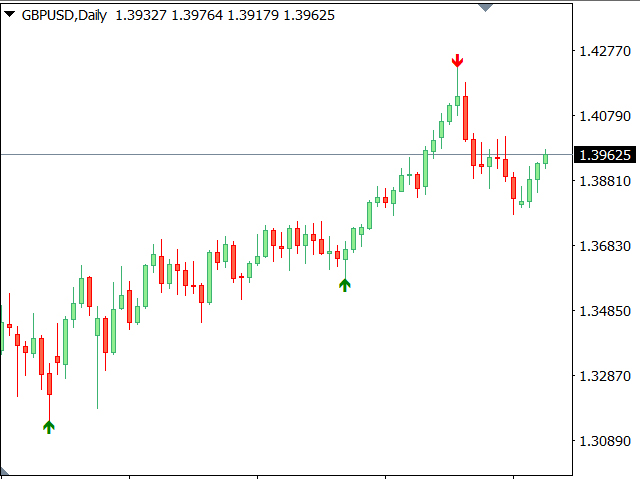
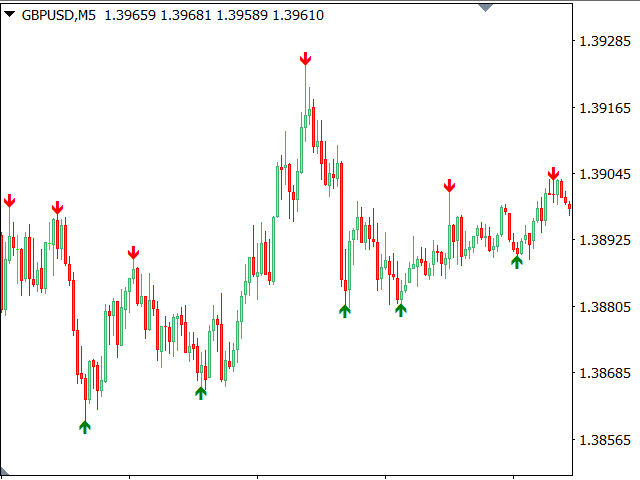
다중 통화 반전 신호 지표
- 신호는 과매도 및 과매수 수준을 기반으로 계산됩니다.
- 이 지표는 모든 거래 상품 및 시간대에서 작동합니다.
- 신호는 추가로 추세 지표에 따라 필터링됩니다.
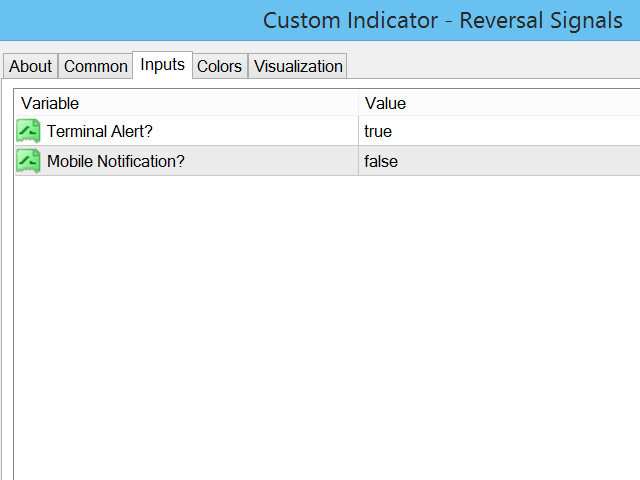
- 화살표 색상은 입력 설정에서 조정할 수 있습니다.
- 알림 옵션: 터미널 경고 및 모바일 장치로의 푸시 알림.
확인 나의 #1 트레이딩 어시스턴트: 66+ 기능 및 지표 포함 | 문의하기 질문이 있으시면
확인 나의 #1 트레이딩 어시스턴트: 66+ 기능 및 지표 포함 | 문의하기 질문이 있으시면
확인 나의 #1 트레이딩 어시스턴트: 66+ 기능 및 지표 포함 | 문의하기 질문이 있으시면
확인 나의 #1 트레이딩 어시스턴트: 66+ 기능 및 지표 포함 | 문의하기 질문이 있으시면