Reversal Signals
- インディケータ
- バージョン: 1.10
- アップデート済み: 31 3月 2022
- アクティベーション: 5

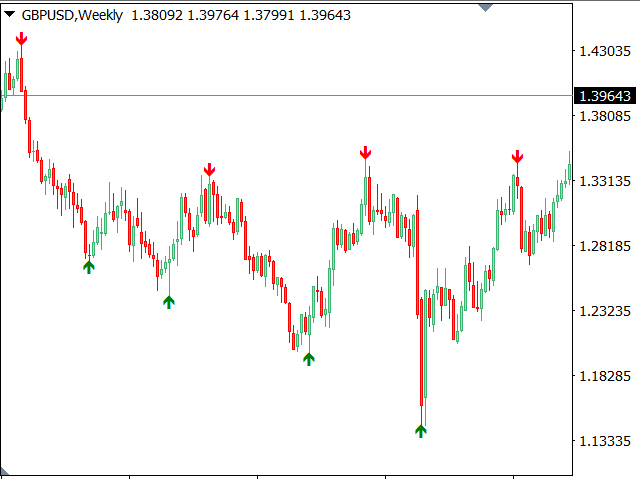
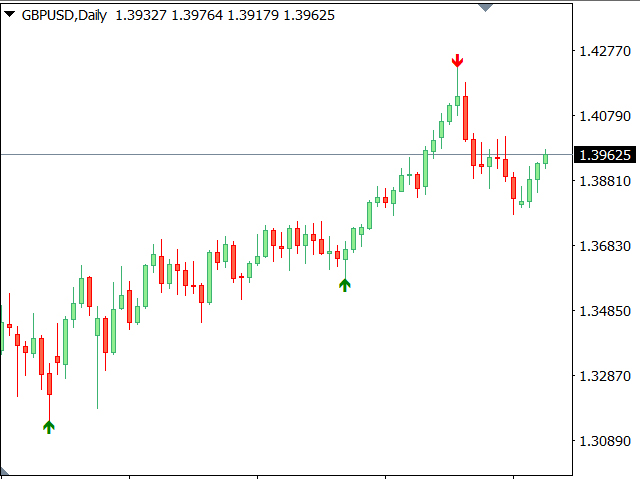
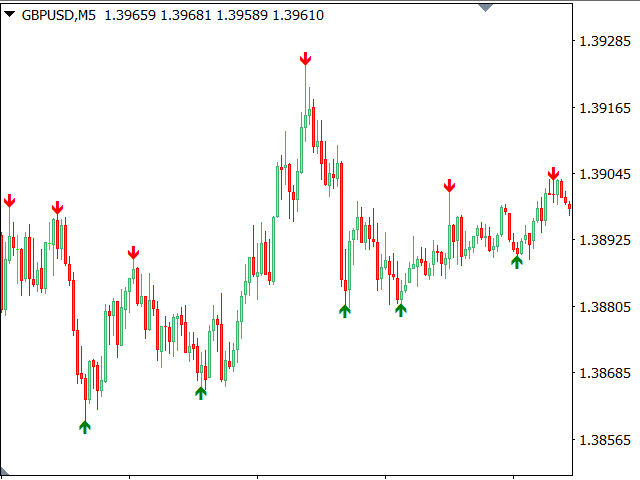
マルチ通貨反転シグナルインジケーター
- シグナルは売られすぎと買われすぎのレベルに基づいて計算されます。
- このインジケーターはすべての取引商品と時間軸で動作します。
- シグナルはトレンドインジケーターでさらにフィルタリングされます。
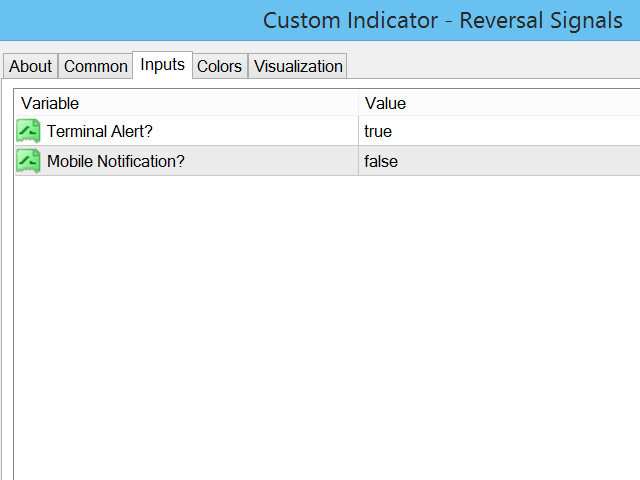
- 矢印の色は入力設定で調整できます。
- 通知オプション:ターミナルアラートとモバイルデバイスへのプッシュ通知。
チェック 私の #1 トレードアシスタント: 66+ の機能とインジケーターを含む | お問い合わせ ご質問があれば