All about ICT time and price
- Indicadores
-
Minh Truong Pham
 Hello, my name is Pham and I am a programmer and trader! At here, I create amazing forex indicators and expert advisors for Metatrader.
I will try:
+ Provide best tools base on my 5 years experience as a trader and 10 years as a programmer. - Versión: 1.2
- Actualizado: 19 diciembre 2023
- Activaciones: 5
Todo sobre el tiempo y el precio por ICT.
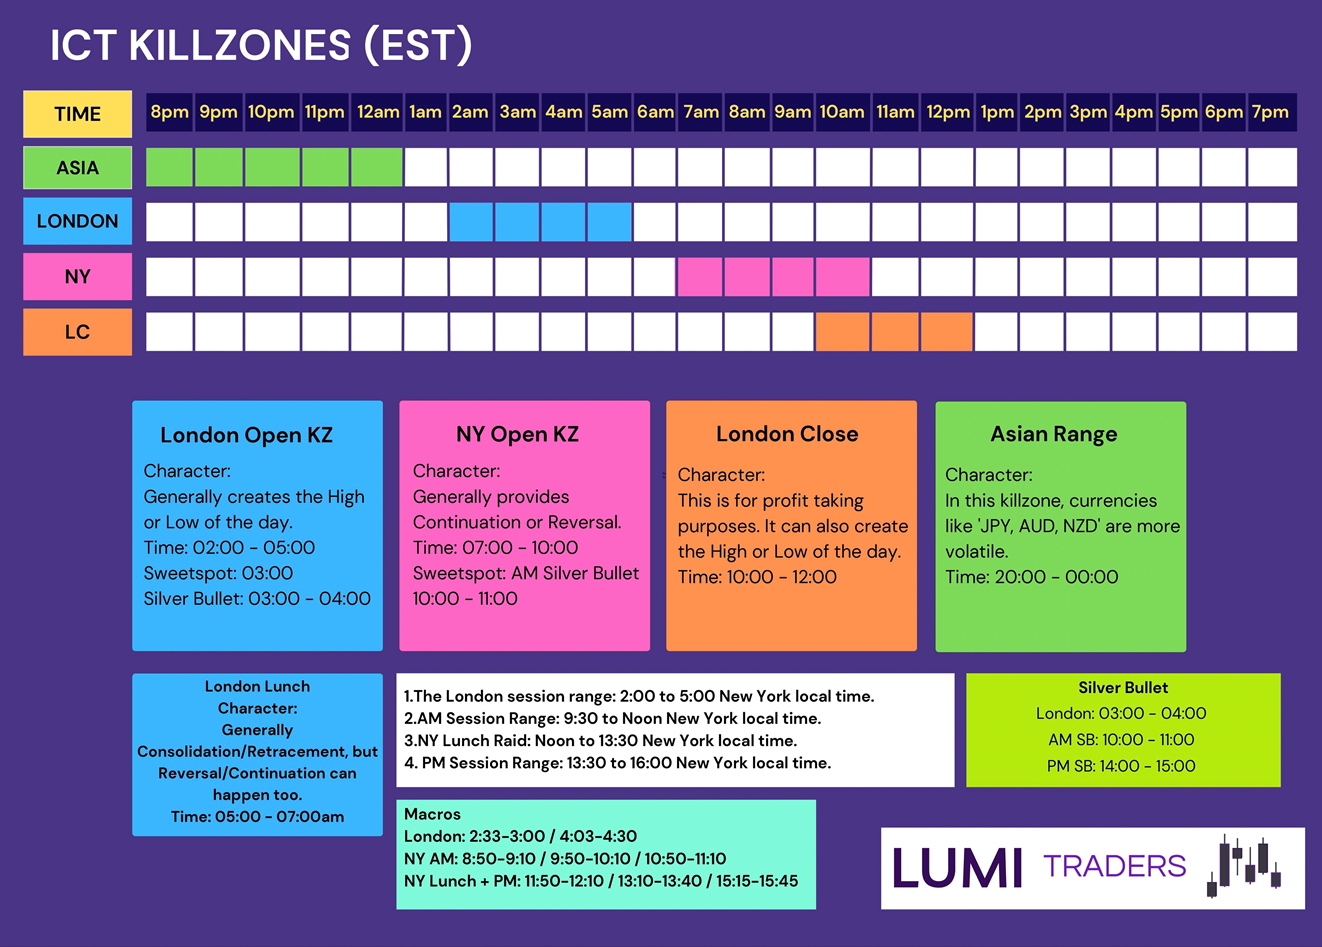
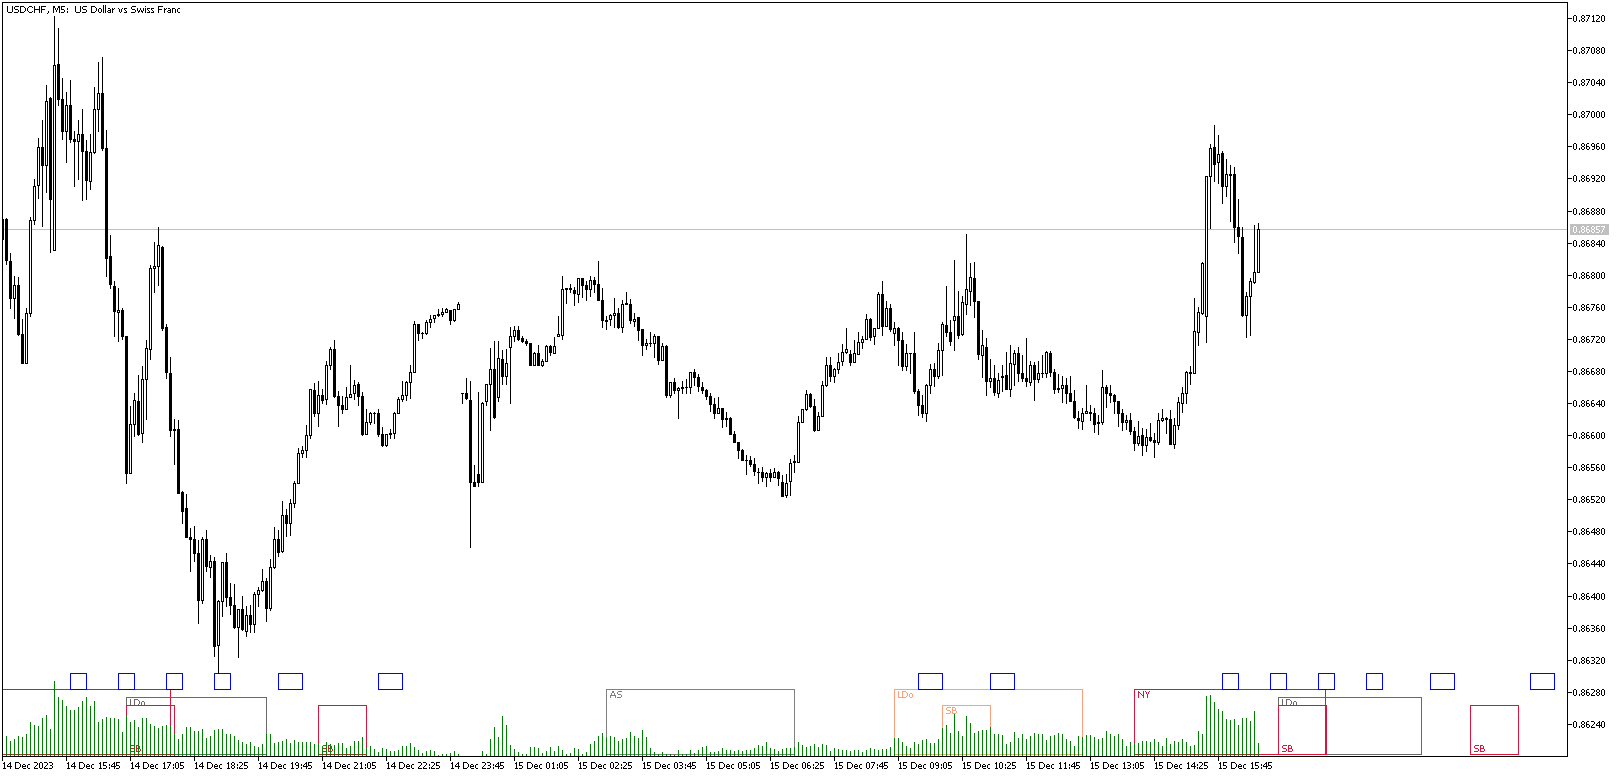
Este indicador proporciona una visión completa de las ICT killzones, Silver Bullet times y ICT Macros, mejorando su experiencia de trading. En esas ventanas de tiempo el precio busca liquidez o desequilibrios y a menudo se encuentran los movimientos más enérgicos del precio y los puntos de inflexión.
Características:
Adaptación automática: Las killzones ICT se adaptan de forma inteligente al gráfico específico que esté utilizando. Para los gráficos de Forex, sigue los horarios de ICT Forex:
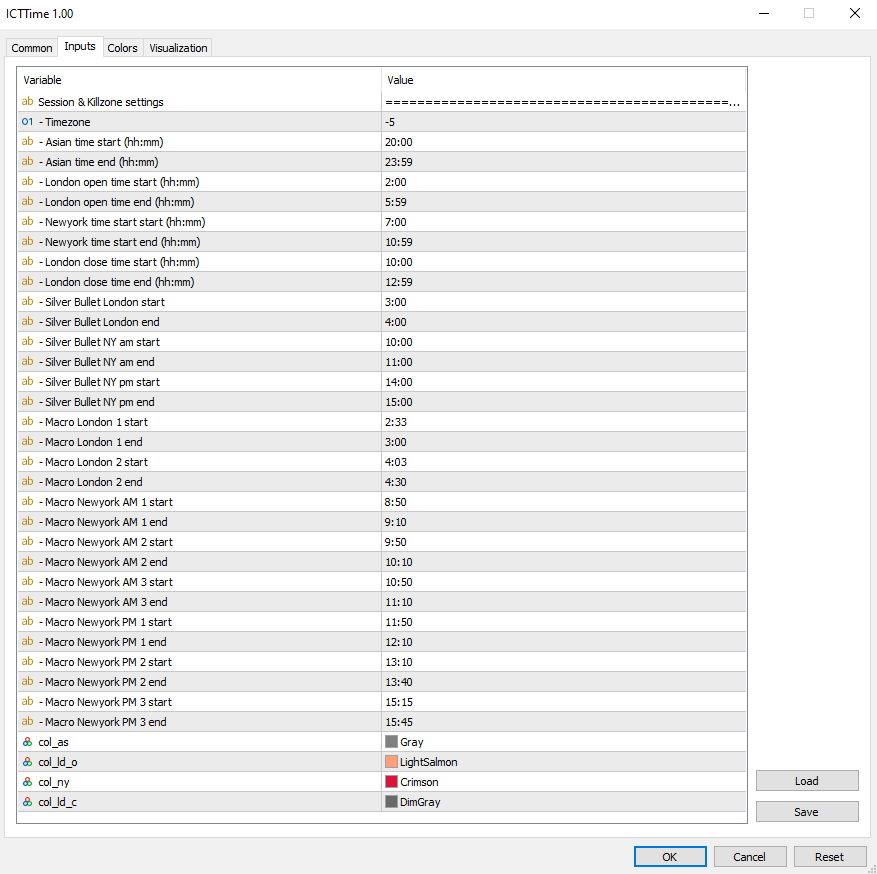
En zona horaria EST:
Sesión:
Asia: 20h00-00h00
Londres: 02h00-05h00
Nueva York: 07h00-112:100h00
Cierre de Londres: 10h00-12h00
Horarios Silver Bullet:
Londres SB: 03h00-04h00
Nueva York AM: 10h00-11h00
Nueva York PM: 14h00-15h00
Macro:
Londres: 2h33-3h00 ; 4h03-4h30
Nueva York AM: 8h50-9h10; 9h50-10h10; 10h50-11h10
Nueva York PM: 11h50-12h10 ; 13h10-13h40 ; 15h15-15h45
Otros: Mostrar/Abrir nuevo día como precio vertical