ADXSignal

Classical ADX revamped to provide faster and more solid trading signals.

This indicator calculates ADX values using standard formulae, but excludes operation of taking the module of ADX values, which is forcedly added into ADX for some reason. In other words, the indicator preserves natural signs of ADX values, which makes it more consistent, easy to use, and gives signals earlier than standard ADX. Strictly speaking, any conversion to an absolute value destroys a part of information, and it makes sense to skip the operation. In addition, the indicator provides additional buffers for your convenience.

The indicator displays 4 lines:

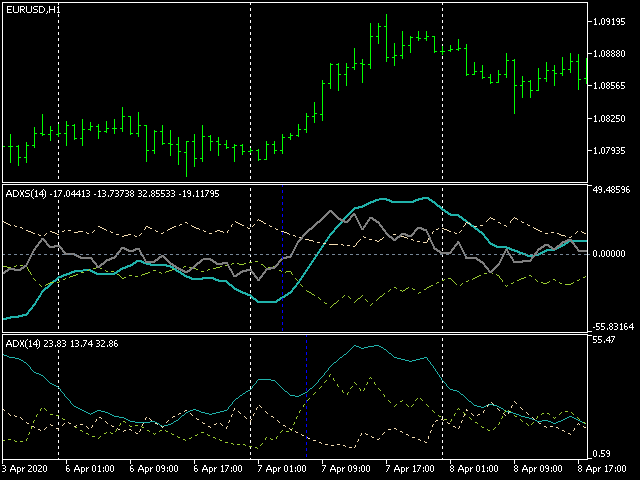
  • ADX with sign - thick light-blue line;
  • +(-DI) negative directional index - dash-dotted light brown line (always positive);
  • -(+DI) inverted positive directional index - dash-dotted light-green line (always negative);
  • (+DI)-(-DI) difference between 2 indices - thick gray line.

Whereas traditional ADX is always positive, ADXSignal may be both positive and negative. The signals of ADXSignal are similar to ADX, but more clear:

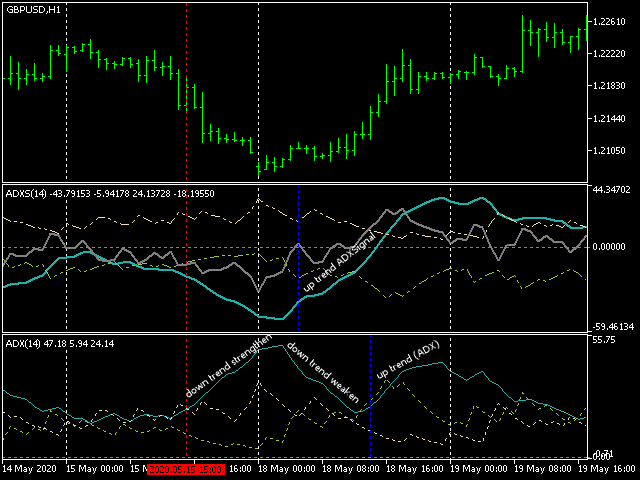
  • When ADXSignal goes up (no matter - above or below 0), trend up is active. When ADXSignal goes down (no matter - above or below 0), trend down is active.
  • The moment when you should open a position in the trend direction is when the directional indices difference has a sign corresponding to the trend. Normally, ADX rules imply you go buy when +DI crosses -DI up, and go short when +DI crosses -DI down, but ADXSignal provides a single convenient buffer for this - the 4-th buffer: if it's > 0, it's OK to buy, when it's < 0, it's OK to sell.
  • You may also notice that +(-DI) and -(+DI) form now a channel, which gives you additional signals and can be treated as a confirmation - for example, when the difference goes outside the channel, the signal becomes more strong than when the difference crosses 0, suitable for position enlarging.

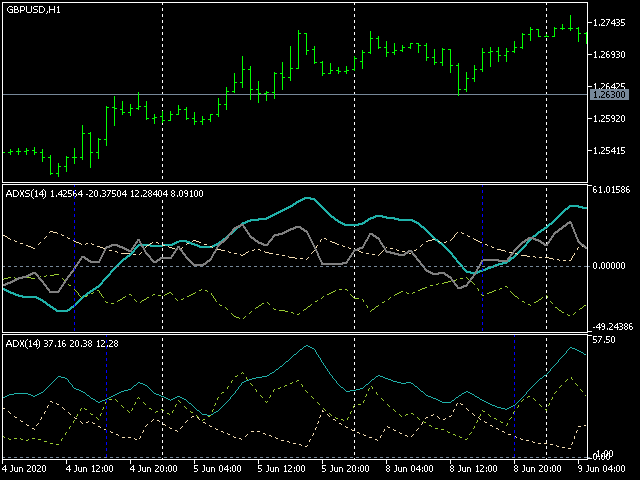
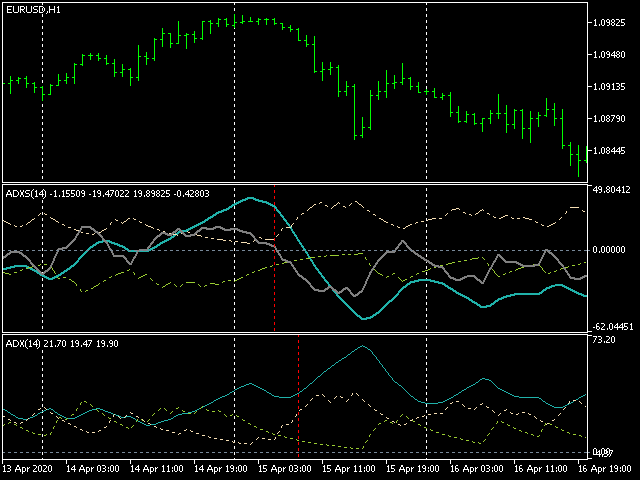
Screenshots below demonstrate how ADXSignal behaves in comparison with conventional ADX. It can be noted that ADXSignal gives signals earlier than ADX. On bars marked by vertical lines ADXSignal produces signals for new trends, but ADX is still falling down and misses optimal entry points.

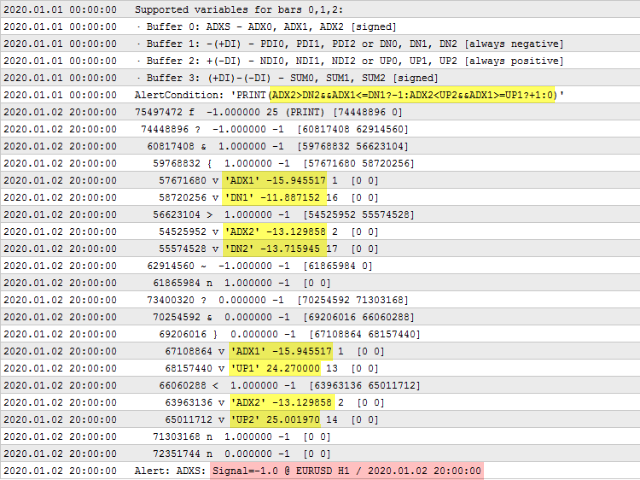
Parameters are ADX period (default - 14) and alert settings (AlertType - built-in alert, e-mail, push-notification, AlertCondition - formula, AlertName - signal name). The formula can use the following variables for 4 buffers on the last 3 bars:

  • Buffer 0: ADXS - ADX0, ADX1, ADX2 [signed]
  • Buffer 1: -(+DI) - PDI0, PDI1, PDI2 or DN0, DN1, DN2 [always negative]
  • Buffer 2: +(-DI) - NDI0, NDI1, NDI2 or UP0, UP1, UP2 [always positive]
  • Buffer 3: (+DI)-(-DI) - SUM0, SUM1, SUM2 [signed]

Example of the formula with 2 signals (buys: +1, +2, sells: -1, -2):

ADX2>DN2&&ADX1<=DN1?-1:ADX2<UP2&&ADX1>=UP1?+1:(SUM2*SUM1<0?(SUM1>0?+2:-2):0)
A similar indicator is available for MetaTrader 4.

Önerilen ürünler
WaveBreaker Pro MT5 — The leader in market momentum analysis. WaveBreaker Pro is a comprehensive, high-tech trading indicator designed for precise market structure visualization. It helps identify potential reversal zones and capture strong price momentum. The core algorithm is built on a balanced combination of classic indicators and oscillators, heavily modified and thoroughly tested. The indicator effectively adapts to any trading style—from aggressive intraday scalping to conservative mediu
Teklif Fiyatı Zamanlayıcı Göstergesi — Hassas Zamanlama ve Akıllı Fiyat Takibi! Teklif Fiyatı Zamanlayıcı Göstergesi ile işlem hassasiyetinizi bir üst seviyeye taşıyın — her hareketinde zamanlamayı, hassasiyeti ve netliği önemseyen trader’lar için tasarlanmış güçlü bir araç. Öne Çıkan Özellikler: Sabit Zamanlayıcı Ekranı – Grafiğinizin sağ tarafında her zaman görünür (özelleştirilebilir X_Offset). Dinamik Fiyat Takibi – Zamanlayıcı, teklif fiyatını gerçek zamanlı olarak takip e
Niubility Trend  Niubility Trend  displays the trend direction for all time frames in real time. You'll see at a glance at which direction the trends are running, how long they last and how powerful they are. All this makes it an easy-to-use trend trading system for beginners, advanced and professional traders. Features Easy to trade Customizable colors and sizes It is non-repainting and non-backpainting It is fantastic as a trailing stop method It implements alerts of all kinds
Multi Timeframe Currency Strength Panel
Narayanan Mohanan Mohanan Krishnan
MTF Currency Strength Panel for MetaTrader 5 Çoklu zaman dilimli döviz gücü göstergesi: 28 ana paritenin tamamı tek bir grafikte. Bu döviz gücü paneli, sekiz ana para biriminin şu anda nerede durduğunu ve 28 ana paritenin her birinin M1'den MN1'e dokuz zaman diliminde nasıl hareket ettiğini birlikte gösterir. Her iki okuma tek bir grafikte yer alır ve bir zamanlayıcıyla güncellenir. Pariteleri tek başına sıralamak yanıltıcıdır. Tek bir para birimi hareket ettiğinde onu içeren her parite de birli
FREE
Overview In the fast-paced world of forex and financial markets, quick reactions and precise decision-making are crucial. However, the standard MetaTrader 5 terminal only supports a minimum of 1-minute charts, limiting traders' sensitivity to market fluctuations. To address this issue, we introduce the Second-Level Chart Candlestick Indicator , allowing you to effortlessly view and analyze market dynamics from 1 second to 30 seconds on a sub-chart. Key Features Support for Multiple Second-Level
Kapanışın hareketli ortalamasından kaç standart sapma uzakta olduğunu gösterir. +2 veya -2'nin ötesindeki değerler istatistiksel olarak aşırı uzamış fiyatları işaretler. Temel özellikler Kapanmış barlarda hesaplanır, değerler yeniden çizilmez Her sembol ve zaman diliminde çalışır Tüm periyotlar, seviyeler ve renkler girdilerden değiştirilebilir Maksimum bar ayarı sayesinde kaynak dostu Kendi Expert Advisor'larınızda kullanılabilecek buffer'lar (iCustom) Buffer'lar 0 Z skoru, 1 Renk (0 normal, 1
FREE
KT DMA is a modified and advanced version of the classic Displaced Moving Averages with buy/sell crossover alerts and a Multi-Timeframe scanner that shows DMA's direction across each real-time time frame. A Displaced Moving Average is a simple moving average that moves ahead or backward in a time frame (either short-term or long-term). It also allows you to predict price movement more accurately. Features Depicts the trend direction using the alignment of three moving averages. Buy/Sell signals
LZ Candle Timer
Lukasz Tomasz Zychal
LZ Candle Timer displays the remaining time before the current bar closes and a new bar forms. It helps you manage entries and exits around candle closes. The indicator uses server time, updates every second, and is optimized for smooth display with minimal CPU use. Feature highlights - Selectable location: place the timer in any of the four chart corners (Upper Left, Upper Right, Lower Left, Lower Right). Offsets and padding are configurable. - Alarm colour: when fewer than X seconds remain
FREE
DoubleBB MARSI — All-in-One Chart Tool Optimized for Day Trading Your price position · Market sentiment · Entry signals — all on one screen In One Line DoubleBB MARSI integrates the three essentials of day trading — daily reference levels · RSI sentiment · Double Bollinger Band signals — into a single chart, helping traders make faster and more confident decisions. Three Benefits You Get DoubleBB MARSI is more than a basic indicator — it gives you everything you need across the entire da
Koala Trend Line
Ashkan Hazegh Nikrou
4.33 (6)
Koala Trend Line Upgraded To Version 1.2 Last Upgrade Improvement : New Parameter Added that allow user to connect trend line to 2nd or 3th or Xth highest or lowest point. My Request : **Dear Customers Please Release Your Review On Koala Trend Line, And Let Me Improve By Your Feed Backs. Join Koala Trading Solution Channel in mql5 community to find out the latest news about all koala products, join link is below : https://www.mql5.com/en/channels/koalatradingsolution WHAT ABOUT OTHER FREE
FREE
This indicator allows you to observe candle formation over a specific period, such as the Nasdaq, which starts at mid-hour. For example, for the first hour. The distance and size of the candle positioned on the right side can be adjusted. Color can also be assigned based on falling and rising candles. The needle can be made visible or invisible if desired. The body size can also be adjusted as desired.
FREE
. . is designed for traders who want a clean and practical way to identify bullish and bearish trend changes directly on the MT5 chart. The indicator uses a dual high/low smoothing engine to detect market direction and show a clear active trend line. When the market confirms a bullish or bearish flip
Ziva LSE System
Hassan Abdullah Hassan Al Balushi
ZIVA LSE System A Professional Liquidity & Structure Execution Framework Executive Overview ZIVA LSE System is a professionally engineered analytical framework designed to interpret market behavior through structural logic and liquidity dynamics. It is not positioned as a conventional indicator. Rather, it functions as a structured execution environment that organizes price action into a clear, disciplined decision-making model. The system is built to deliver consistency, clarity, and controlled
Provlepsis Göstergesine hoş geldiniz. "Provlepsis", MQL Piyasası için tasarlanmış son derece gelişmiş bir göstergedir. Aynı günün önceki çubuklarını analiz ederek, piyasanın potansiyel hareket aralığını doğru bir şekilde hesaplar ve gelecekteki fiyat dalgalanmaları hakkında değerli bilgiler sunar. Geleneksel ATR göstergesinin aksine, "Provlepsis" zaman faktörünü dikkate alarak farklı piyasa koşullarına uyum sağlayan daha güçlü bir araçtır. Gece saatlerinde gösterge daha dar bir aralık tahmin ede
FREE
Fundamental Signals Indicator is a Non-Repaint Indicator with a powerful calculation engine that can predict market movement over 3000 pips (30000 points). The indicator does not analyze the market fundamentally, it is named fundamental because it can predict trends with large movements, no complicated inputs and low risk. Also Indicator can alert on market trend changes. Using Indicator : The Indicator is very simple and without complicated input parameters. (No need to optimize anything.)T
Institutional Orderflow Entry Scanner Volume Profile • Value Area • Order Blocks • Multi-Symbol Scanner Turn your chart into a professional institutional order-flow cockpit. This indicator scans up to 60 Market Watch symbols in real time, detects high-probability setups from three proven Value-Area strategies, and delivers clean, actionable entries with institutional-grade risk management — all on a single, flicker-free interface. What It Does The scanner continuously analyses the previous sess
Bu çoklu zaman dilimi göstergesi, MT5 platformunda Giant’ın geleneğini sürdürüyor.  Farklı grafiklerden sinyaller toplayan yazarın göstergelerine dayanmaktadır.  Çoğu zaman fiyat, belirtilen yönde birkaç dakika içinde hareket etmeye başlar. Sinyallerin aynı yönde sık sık tekrarlanması, oluşmuş bir trendin olduğunu gösterir. Tüccar için sinyaller, grafikteki oklar ve uyarılardır.  Her şey ticaret için ayarlanmıştır.  Sadece istediğiniz döviz çiftini belirtmeniz yeterlidir. Göstergenin M5 grafiğ
The   Clean Trading Sessions indicator  shows the most significant trading sessions for the Forex market, such as London, New York, Tokyo. The   Clean Trading Sessions indicator is a simple and, at the same time, quite functional Forex sessions indicator, developed for the MT5 terminal. It is available to download for free. How is this Forex market session indicator used? Traders normally use trading sessions to determine the volatile hours throughout the day, since the trading activities vary
FREE
AURUM MID-QUANT PRO v5.60 Quantitative Excellence for Gold (XAU/USD) & Volatility Trading Gain a professional edge over institutional markets with AURUM MID-QUANT PRO , an advanced Price Action Pattern Detection and Breakout Engine designed exclusively for MetaTrader 5 . Built specifically to capture the unique volatility of Gold (XAU/USD) and other major financial instruments, this powerful indicator combines high-precision algorithmic pattern recognition with real-time dynamic accumulation z
Multi Timeframe Analysis
Teerathad Booranawisedkul
FREE 7-DAY TRIAL After your trial ends, continue using this essential trading tool for only $30 one-time payment. Multi-Timeframe Dashboard Indicator A comprehensive multi-timeframe analysis tool that displays market conditions across 9 timeframes simultaneously on a single dashboard panel. Timeframes Analyzed M1, M5, M15, M30, H1, H4, D1, W1, MN Toggle visibility for each timeframe individually Analysis Metrics Trend - EMA crossover status (Strong/Weak/Bearish/Neutral) Power - ADX strength p
FlatOut Movings Robot: Yatay piyasanın (flat) mutlak kontrolü. Trendde güvenli navigasyon. Hareketli ortalamalara (moving average) dayalı indikatör stratejilerinin ortak bir kabusu vardır. Piyasa faz değiştirdiği an, bakiyeniz erimeye başlar. Klasik hareketli ortalamalar, yatay piyasada onlarca sahte kesişim üretir. Standart filtreler ise acımasızca gecikir. Geceleri terminal başında stres içinde oturur ve hareketin tam bitiş noktasında işleme girersiniz. Bu yazılım belirli bir görevi çözmek iç
Kısa Açıklama: Gizli alış ve satış baskısını ortaya çıkarmak için mum geometrisini çözen yüksek performanslı bir hacim duyarlılığı osilatörü. Piyasa emilimi (absorption), tükenme, uyumsuzluk ve trend devamını belirlemek için idealdir. Tam Açıklama: Volume Momentum Delta göstergesi, standart fiyat çubuklarının ötesini görmek isteyen yatırımcılar için tasarlanmıştır. Çoğu hacim göstergesi yalnızca toplam aktiviteyi gösterirken, Volume Momentum Delta gelişmiş mum geometrisi mantığını kullanarak h
FREE
Momentum Shift EA
Daniel Naranjo Morales
Momentum Shift EA Momentum Shift EA , özellikle   USDJPY   paritesi ve   H1 zaman dilimi   için geliştirilmiş otomatik bir alım-satım sistemidir. Temel stratejisi, potansiyel piyasa dönüş noktalarını belirlemeye ve momentumdaki değişimlerden faydalanmaya dayanır. EA, mevcut piyasa yönünün yorulma belirtileri gösterdiği anlarda işlemlere girmeyi hedefleyerek, trend karşıtı (counter-trend) bir temelde çalışmak üzere tasarlanmıştır. Klasik teknik göstergelerin bir kombinasyonunu analiz ederek, EA'
Gold Crazy EA MT5
Nguyen Nghiem Duy
Gold Crazy EA   is an Expert Advisor designed specifically for trading Gold H1/ EU M15. It use some indicators to find the good Entry. And you can set SL or you can DCA if you want. It can be an Scalping or an Grid/ Martingale depend yours setting. This EA can Auto lot by Balance, set risk per trade. You also can set TP/ SL for earch trade or for basket of trade. - RSI_PERIOD - if = -1, then the default strategy works, if >0, then the RSI strategy works - MAX_ORDERS - to trade with only 1 order,
G2 Entry Signal
Ida Bagus Putu Mahardika
G2 ENTRY SIGNAL by Ida Bagus Putu Mahardika STRATEGY DESCRIPTION G2 Entry Signal is a professional multi-strategy entry dashboard that combines top-down analysis with 3 proven trading strategies in one powerful indicator. Designed for traders who demand clarity, accuracy, and actionable signals, this tool filters market noise and delivers high-probability entry opportunities directly on your chart. KEY ADVANTAGES 1. 3 STRATEGIES IN ONE DASHBOARD Strategy 1 – London Session Breakout:   Capt
FREE
NEXA Ha MTF Trend NEXA Ha MTF Trend, üst zaman dilimindeki Heiken Ashi trend onayı ile M15 zaman dilimindeki hacim tabanlı tetikleme mantığını birleştiren MetaTrader 5 için geliştirilmiş bir Expert Advisor’dır. EA, H4 Heiken Ashi yönünü ana trend filtresi olarak kullanır ve M15 üzerinde OBV, hacim aktivitesi, mum yapısı, ATR, ADX, spread ve işlem zamanı koşullarını kontrol eder. Yeni girişler yalnızca üst zaman dilimi yönü ile alt zaman dilimi tetikleme koşulları uyumlu olduğunda değerlendirilir
Ticaret katında karı en üst düzeye çıkarmak için nihai araç olan Trend Coşku Göstergesi (TEI) ile tanışın. Bu yenilikçi gösterge, trend analizinin gücünü piyasa duyarlılığının heyecanıyla birleştirerek, tüccarlara sürekli değişen finansal piyasalarda benzersiz bir avantaj sağlar. TEI, bir finansal aracın altında yatan eğilimi ve tacirlerin yüksek kârlı fırsatları belirleme hevesini analiz etmek için gelişmiş algoritmalar kullanır. Bu, tüccarların minimum riskle tutarlı karlar sağlayarak, tren
AstraQuant AI Ribbon Matrix AI-Style EMA Ribbon Trend Indicator for MT5 AstraQuant AI Ribbon Matrix is built for traders who want a clean, premium, visual trend system directly on the MT5 chart. It combines multi-EMA ribbon structure, AI-style confidence scoring, MTF trend alignment, smart buy/sell signals, and TP/SL planning  Why Traders Choose This Indicator Premium EMA Ribbon: clearly shows trend direction, compression, expansion, and momentum. Buy/Sell Signal Arrows: visual entry signals de
IchimokuStructure
Venicius Soares Da Silva
Ichimoku Structure S/R is a chart-window dashboard for M1: it classifies price vs Tenkan / Kijun / cloud as bullish, bearish, or range, shows the nearest Ichimoku level as a live S/R reference, flags impulsive breaks against that structure with historical context, and optionally monitors deal execution vs quotes plus a live structure-episode validation panel. It draws no classic Ichimoku lines (display is labels/panel). Research baseline baked into the tool is EURUSD M1 (2016-08-17 → 2026-06-09)
Tahmin etmeyi bırakın. İstatistiksel avantajla işlem yapmaya başlayın. Hisse senedi endeksleri forex gibi işlem görmez. Tanımlanmış seansları vardır, gecelik boşluklar oluştururlar ve öngörülebilir istatistiksel kalıpları takip ederler. Bu gösterge, DAX, S&P 500 ve Dow Jones gibi endeksleri güvenle işlem yapmanız için ihtiyaç duyduğunuz olasılık verilerini sağlar. Onu farklı kılan nedir Çoğu gösterge size ne olduğunu gösterir. Bu, muhtemelen bir sonra ne olacağını gösterir. Her işlem gününde, gö
Bu ürünün alıcıları ayrıca şunları da satın alıyor
Trend Sniper X
Sarvarbek Abduvoxobov
4.86 (44)
Trend Sniper X , tüccarların trend yönünü ve olası dönüş noktalarını netlik ve hassasiyetle belirlemelerine yardımcı olan MetaTrader 5 için çoklu zaman dilimli bir trend takip göstergesidir. MT4 için: https://www.mql5.com/en/market/product/193245 Fiyat Bilgisi: Mevcut fiyat tanıtım amaçlıdır ve gelecek güncellemeler ile yeni özellikler yayınlandıkça değişebilir. Bonus Fırsatı: Bu indikatör için ÜCRETSİZ Oto-Trade Assistant EA'yı almak için lütfen satın aldıktan sonra yazara mesaj gönderin. Code
Şehre yeni bir Kral geldi - Gösterge + Emir Yönetimi göstergeleri (TP1 + TP2 + TP3) + Opsiyonel Telegram Sinyal Gönderici DAHİL (ÜCRETSİZ) (TAM TRADING ve SİNYAL SİSTEMİ) Altın için en iyi EA’mız: Gold Slayer Bu gösterge; gelişmiş bir strateji, özelleştirilebilir emir yönetimine sahip bir trading sistemi ve envelope uzantılarını birleştiren bir mean reversion sistemi içerir. Ayrıca RSI gibi birçok akıllı onay filtresiyle desteklenerek yüksek olasılıklı dönüş girişlerini AL ve SAT sinyalleriyle y
Smart Trend Trading System — MetaTrader 5 Satın aldıktan sonra Smart Universal Expert Advisor'ı ÜCRETSİZ edinmek ve beraberinde çevrimiçi kurs, PDF kılavuzu ve özel gruba erişim almak için MQL5 üzerinden bana mesaj gönderin. STTS; trend yönünü, giriş ve çıkış sinyallerini, dönüş bölgelerini ve önemli fiyat seviyelerini doğrudan grafiğinizde bir araya getirir. Sistemi manuel işlemler için kullanabilir veya ayrı bir uyumlu EA’yı bağlayarak seçtiğiniz ayarlarla otomatik işlem gerçekleştirebilirsini
Entry Points Pro, emri vermeden önce nereden gireceğinizi, stopu nereye koyacağınızı ve hangi lotla işlem yapacağınızı gösterir. FİYAT Şu anda 199 USD: bu fiyattan 8 kopya, sonra 249 USD. Nihai fiyat 349 USD. Paramı piyasalarda işlem yaparak kazanıyorum ve bunu gösteriyorum, bu yüzden bu indikatörü herkese satmak zorunda değilim. Bu, kendi kafasıyla düşünen traderlar için bir araç, sihirli bir düğme değil. Kırılım yoksa işlem de yok. Gri ok, iptal edilmiş bir sinyaldir: fiyat sinyal mumunu kırm
Zoryk Gold
Reda El Koutbane
4.79 (19)
ZORYK — MetaTrader 5 İçin Gelişmiş XAUUSD Sinyal Sistemi Bu hissi biliyorsunuz. Altını analiz etmek için uzun zaman harcarsınız. Doğru giriş noktasını beklersiniz. Sonunda işlemi açarsınız ve fiyat hemen aleyhinize hareket etmeye başlar. İşlemi çok erken kapatırsınız, Stop Loss seviyesini değiştirirsiniz veya birkaç saniye tereddüt edersiniz. Daha sonra piyasa, başlangıçta beklediğiniz hedefe tam olarak ulaşır; ancak siz artık işlemin içinde değilsinizdir. Sorun her zaman yön değildi. Asıl sorun
İşlem avantajınızı görüş alanınıza alın! M5 Sniper , MeanFX tarafından geliştirilen yeni bir indikatördür. Hassas işlem sinyallerini adaptif TP/SL seviyeleriyle birleştirir — bunun sonucunda mümkün olan en iyi istatistiksel işlemleri oluşturur! Fiyat her 5 satın alımda bir artar, bir sonraki fiyat 69$ olacaktır. Satın aldıktan sonra ipuçları/rehber ve bonus EA almak için bana mesaj gönderin. Onu öne çıkaran nedir? Kanıtlanmış istatistiksel performans Gold XAUUSD üzerinde ( neredeyse her varlıkta
Gann Made Easy , bay teorisini kullanarak ticaretin en iyi ilkelerine dayanan, profesyonel ve kullanımı kolay bir Forex ticaret sistemidir. WD Gann. Gösterge, Zararı Durdur ve Kâr Al Seviyeleri dahil olmak üzere doğru SATIN AL ve SAT sinyalleri sağlar. PUSH bildirimlerini kullanarak hareket halindeyken bile işlem yapabilirsiniz. Satın alma işleminden sonra, alım satım talimatlarını ve harika ek göstergeleri ücretsiz olarak almak için lütfen benimle iletişime geçin! Muhtemelen Gann ticaret yöntem
SuperScalp Pro
Van Minh Nguyen
4.54 (37)
SuperScalp Pro - Professional Multi-Layer Confluence Scalping System SuperScalp Pro, klasik Supertrend sistemini birden fazla akıllı doğrulama filtresiyle geliştiren ileri düzey bir scalping göstergesidir. Yanlış sinyalleri önemli ölçüde azaltırken başarı olasılığı daha yüksek Buy/Sell işlem fırsatlarını belirlemenize yardımcı olur. Buy ve Sell okları doğrudan grafik üzerinde net bir şekilde görüntülenir. ATR tabanlı Stop Loss ve Take Profit seviyeleri de gerçek zamanlı olarak otomatik hesaplanı
Ultra Indicator
Ihor Otkydach
5 (1)
ULTRA, “hepsi bir arada” prensibiyle çalışan bir teknik göstergedir; piyasayı bağımsız olarak analiz eder, işlem sinyalleri üretir, stop-loss emirlerinin verileceği seviyeleri gösterir ve kârı garantilemek ya da zararı en aza indirmek için işlemlerin ne zaman kapatılması gerektiğini önerir. Başka bir deyişle, piyasayı nasıl analiz edeceğinizi bilmeseniz, seviyeleri (stop-loss'unuzu nereye koyacağınızı) belirleyemeseniz ya da para yönetimi konusunda zorluk yaşasanız da fark etmez. ULTRA tüm bunla
Gold Trend Coach MT5
Cristhian Alexander Gaibor Cuasquer
4.27 (11)
MetaTrader 5 için altında (XAUUSD) repaint yapmayan al-sat sinyalleri. Her sinyal bir stop loss ve üç take profit ile gelir. BOS ve CHoCH içeren Smart Money Concepts filtresi sayesinde yapıya karşı değil, yapıyla birlikte işlem açarsın. Paneldeki canlı Mentor, girişten TP3'e kadar her adımda sana yol gösterir. Alarmlar doğrudan telefonuna ve kendi Telegram kanalına gelir. İşte Gold Trend Coach. Artık asla yalnız işlem yapma. Satın alımla birlikte ÜCRETSİZ ALICI KİTİ: 1. Telegram Alert Bridge: s
GoldenX Entry MT5
VividMind Digital Solutions
5 (17)
GoldenX Entry, adaptif Smart Entry Trend algoritmasına, sinyal skorlaması sistemine, piyasa rejimi algılayıcısına ve volatilite filtresine sahip bir MT5 indikatörüdür. Her sinyal; hesaplanmış bir giriş seviyesi, üç adet Take-Profit seviyesi (TP1, TP2, TP3) ve bir Stop-Loss seviyesi içerir. Farklı piyasa koşullarına uyum sağlamak için tasarlanmış çok katmanlı analitik yapı üzerine kuruludur ve yerleşik optimizasyon aracı ile istatistik takip sistemini birleştirir. Risk-ödül (RR) metrikleri ve geç
SMC Intraday Formula
VividMind Digital Solutions
5 (26)
Önce dürüst olalım. Hiçbir gösterge tek başına sizi kârlı yapmaz. Eğer biri size aksini söylüyorsa, size bir hayal satıyordur. Mükemmel al/sat okları gösteren her gösterge, kusursuzmuş gibi görünecek şekilde yapılabilir — sadece geçmişin doğru bir bölümünü yakınlaştırıp kazanan işlemleri ekran görüntüsü almanız yeterlidir. Biz bunu yapmıyoruz.  SMC Intraday Formula bir araçtır. Piyasa yapısını sizin için okur, en yüksek olasılıklı fiyat bölgelerini belirler ve şu anda akıllı paranın izinin nası
Boba Analysis Suite
Trade Ready Solutions LLC
5 (2)
Boba Analysis Suite Boba Analysis Suite, MetaTrader 5 için geliştirilmiş bir analiz göstergesidir. Piyasa yapısını, önemli fiyat bölgelerini ve genel piyasa bağlamını tek bir grafik görünümünde bir araya getirir. Trader ve trading eğitmeni olarak edinilen uygulamalı deneyimden yola çıkarak geliştirilmiştir. Piyasanın yönünü değerlendirme, önemli seviyeleri belirleme ve birden fazla zaman dilimini birlikte inceleme gibi adımlardan oluşan sistematik bir analiz sürecini destekler. Piyasa Bağlamını
FX Power MT5 NG
Daniel Stein
5 (33)
FX Power: Daha Akıllı Ticaret Kararları için Para Birimlerinin Gücünü Analiz Edin Genel Bakış FX Power , her piyasa koşulunda başlıca para birimlerinin ve altının gerçek gücünü anlamak için vazgeçilmez bir araçtır. Güçlü para birimlerini alıp zayıf olanları satarak, FX Power ticaret kararlarınızı basitleştirir ve yüksek olasılıklı fırsatları ortaya çıkarır. İster trendlere sadık kalın ister Delta'nın aşırı değerlerini kullanarak tersine dönüşleri öngörün, bu araç ticaret tarzınıza mükemmel bir
M1 Sniper MT5
Oleg Rodin
5 (7)
M1 SNIPER   kullanımı kolay bir işlem göstergesi sistemidir. M1 zaman dilimi için tasarlanmış bir ok göstergesidir. Gösterge, M1 zaman diliminde scalping için bağımsız bir sistem olarak kullanılabilir ve mevcut işlem sisteminizin bir parçası olarak kullanılabilir. Bu işlem sistemi özellikle M1'de işlem yapmak için tasarlanmış olsa da, diğer zaman dilimleriyle de kullanılabilir. Başlangıçta bu yöntemi XAUUSD ve BTCUSD ticareti için tasarladım. Ancak bu yöntemi diğer piyasalarda işlem yaparken de
FiboSniper Pro
Van Minh Nguyen
5 (4)
FiboSniper Pro – Multi-Filter Fibonacci System with Auto SL/TP and Control Panel FiboSniper Pro, seçilmiş Buy ve Sell sinyalleri üretmek için dinamik Fibonacci Envelopes ile birden fazla doğrulama filtresini birleştiren teknik bir göstergedir. Fibonacci seviyeleri Moving Average ve ATR temel alınarak hesaplanır ve ardından ADX, EMA, RSI, ATR, Volume, Time ve Candle yapısı ile filtrelenir. Gösterge, ATR tabanlı otomatik Stop Loss ve Take Profit seviyelerini doğrudan grafik üzerinde görüntüler ve
Apex Patterns PRO İndikatörü Satın Alın - Üzerine Kurulu Expert Advisor'a ÜCRETSİZ Sahip Olun. Kendini Optimize Eden Grafik Formasyonu ve Kırılım Zekası Geleneksel formasyon tarayıcıları sabit girdilere dayanır ve piyasa volatilitesi ile yapıları değiştiğinde genellikle düşük performans gösterir. Apex Patterns PRO, yapısal grafik formasyon tanımayı, momentum filtrelemeyi ve istatistiksel kendi kendini optimizasyonu tek bir analitik çerçevede birleştirerek değişen piyasa koşullarına uyum sağlama
Auto Optimized SpeedAngle , sürekli İleriye Dönük Optimizasyon (Walk-Forward Optimization, WFO) yoluyla eğri uydurmayı (curve-fitting) ortadan kaldıran kurumsal düzeyde bir momentum vektörleme sistemidir. Piyasa rejimleri değiştiğinde etkinliğini yitiren statik girdilere güvenmek yerine, gösterge, örneklem dışı (Out-of-Sample, OOS) doğrulama kullanarak parametrelerini dinamik olarak yeniden kalibre eder ve böylece gösterilen sinyallerin geçmişteki rastgele anomalileri değil, gerçek bir istatisti
Sqn Max Indicator Sqn Max is an exclusive indicator to trade the market with high effectiveness. The indicator is based on price action, volatility and trend. This indicator is as simple as possible but not too simple. The indicator can generate alerts to ease the trading process. You don't have to stay all day in front of your screen. The indicator can be used with any class of assets and with any time frame. It is possible to achieve better results trading our list of selected assets. We achi
Sonraki Güncelleme — Sürüm 2.52 Çok Yakında! [YENİ] Piyasa Analizinizi ve İşlem Sürecinizi Geliştirmek İçin Tasarlanmış 4 Büyük Yeni Özelliğe Hazır Olun İşlem ihtiyaçlarınızı karşılamak üzere tasarlanmış 4 yeni özellikle piyasa analizini bir üst seviyeye taşıyoruz. İşte yeni özellikler: 1. TRADE OVERVIEW DASHBOARD 2. CONFLUENCE AT ZONE 3. STRONG & WEAK HIGH/LOW 4. OTE 1. TRADE OVERVIEW DASHBOARD Piyasanın genel görünümünü daha kolay anlamanıza yardımcı olan, işlem kararlarınızı desteklemek için
Divergence Bomber
Ihor Otkydach
4.89 (94)
Bu göstergeyi satın alan herkese aşağıdaki ekstra içerikler ücretsiz olarak sunulmaktadır: Her işlemi otomatik olarak yöneten, Stop Loss ve Take Profit seviyelerini ayarlayan ve işlemleri strateji kurallarına göre kapatan özel yardımcı araç: "Bomber Utility" Göstergenin farklı varlıklar üzerinde kullanılmasına yönelik ayar dosyaları (set dosyaları) Bomber Utility için 3 farklı modda kullanım sunan ayar dosyaları: "Minimum Risk", "Dengeli Risk" ve "Bekle-Gör Stratejisi" Bu ticaret stratejisini
Power Candles MT5
Daniel Stein
4.58 (12)
Power Candles V3 - Kendi Kendini Optimize Eden Güç Göstergesi Power Candles V3, döviz ve enstrüman gücünü, eklendiği her grafikte eyleme geçirilebilir bir ticaret planına dönüştürür. Sadece mumları renklendirmek yerine, arka planda canlı bir otomatik optimizasyon çalıştırır ve önünüzdeki sembol için en iyi Stop Loss, Take Profit ve sinyal eşiğini size sunar. Tek bir tıklama ile canlı ticarete uyarlanır - giriş, Stop Loss ve Take Profit ışınları grafikte tam fiyatlarla görünür ve uyarılar yön bil
Currency Strength Wizard , başarılı ticaret için size hepsi bir arada çözüm sağlayan çok güçlü bir göstergedir. Gösterge, birden çok zaman dilimindeki tüm para birimlerinin verilerini kullanarak şu veya bu forex çiftinin gücünü hesaplar. Bu veriler, şu veya bu para biriminin gücünü görmek için kullanabileceğiniz, kullanımı kolay para birimi endeksi ve para birimi güç hatları biçiminde temsil edilir. İhtiyacınız olan tek şey, işlem yapmak istediğiniz tabloya göstergeyi eklemektir ve gösterge size
Atomic Analyst MT5
Issam Kassas
4.51 (65)
Atomic Analyst — MetaTrader 5 Satın aldıktan sonra Smart Universal Expert Advisor'ı ÜCRETSİZ edinmek ve beraberinde çevrimiçi kurs, PDF kılavuzu ve özel gruba erişim almak için MQL5 üzerinden bana mesaj gönderin. Atomic Analyst; fiyat hareketini, trend yönünü, giriş ve çıkış sinyallerini, Stop Loss ve birden fazla Take Profit seviyesini doğrudan grafiğinizde bir araya getirir. SİNYALİ GÖRÜN. İŞLEM KOŞULLARINI ANLAYIN. Atomic Analyst, analizini anlaşılır görsel bilgiler halinde sunar: • Olası gir
Unix Scalper
Issam Kassas
4 (4)
Unix Scalper — MetaTrader 5 Satın aldıktan sonra Smart Universal Expert Advisor'ı ÜCRETSİZ edinmek ve beraberinde çevrimiçi kurs, PDF kılavuzu ve özel gruba erişim almak için MQL5 üzerinden bana mesaj gönderin. İşlem fırsatını belirleyin. Planı görün. Nasıl işlem yapacağınıza karar verin. UNIX Scalper; piyasa analizini, BUY/SELL/WAIT kararlarını ve Entry, Stop Loss, TP1 ve TP2 seviyelerini düzenli bir panelde bir araya getirir. SİNYALİ VE PLANI GÖRÜN • Net kararlar: BUY, SELL veya WAIT. • Belir
Astral Structure
Ottaviano De Cicco
Astral Structure Kurulumu değerlendirin. İlk planı görün. Lansmana özel - $99. Lansman sonrasında $149. Bir piyasa yapısı kurulumu birkaç soruyu birlikte getirir: Geniş görünüm uyumlu mu, stop referansı nerede ve hedefler nasıl tanımlanıyor? Astral Structure, kararlarını piyasa yapısına dayandıran takdire dayalı yatırımcılar için bu soruları tek çalışma alanında toplar. İlgili kuruluma odaklanın. En son uygun kurulumu, yönünü ve koşulları karşılayıp karşılamadığını birlikte inceleyin. Zaman dili
Tokyo mt5 Indicator
Vasiliy Strukov
5 (15)
Tokyo Indicator; trend yönü, potansiyel işlem sinyalleri ve piyasa koşulları hakkında net ve görsel bir genel bakış sunar. Renk kodlu ve kademeli trend çizgisi, yükseliş evrelerini (mavi) düşüş evrelerinden (macenta) ayırt eder. Trend değiştiğinde, buna karşılık gelen yön okları potansiyel alım ve satım fırsatlarını vurgular. Entegre bir panel; mevcut sinyali, piyasa eğilimini, momentumu, volatiliteyi ve sinyal kalitesini tek bir kullanışlı görünümde bir araya getirir. Bu sayede yatırımcılar, fa
Çoklu Para Birimi Güç ve Momentum Göstergesi MT5 Dynamic Forex28 Navigator, uzun süredir popüler olan göstergelerimizin evrimidir ve beşinin gücünü bir arada sunar: Advanced Currency Strength28 Indicator (700 inceleme) Advanced Currency IMPULSE with ALERT (530 inceleme) Currency Strength EXOTICS GOLD Impulse with Alert CS28 Combo Signals (son Bonus) Dört gösterge satın alıp grafiklerinizde üst üste yığmanıza gerek yok. Hepsi tek bir güçlü göstergede birleşiyor: 28 Forex paritesinin gücü, onları
Scalper Vault, gün içi işlemlerde istikrar yakalamak isteyen yatırımcılar için tasarlanmış, güçlü ve tam donanımlı bir alım satım sistemidir. Bu yüksek hassasiyetli gösterge; hem Forex hem de İkili Opsiyon yatırımcıları için kurumsal düzeyde analizler sunan, bağımsız ve eksiksiz bir alım satım sistemi işlevi görür. SATIN ALIM İŞLEMİNDEN SONRA BENİMLE İLETİŞİME GEÇİN; ALIM SATIM İPUÇLARIMI VE HARİKA BİR BONUSU ALIN! Tahmin yürütme zorunluluğunu ve karmaşık manuel analiz süreçlerini ortadan kaldı
Axiom Matrix
Issam Kassas
5 (9)
Satın aldıktan sonra Smart Universal Expert Advisor'ı ÜCRETSİZ edinmek ve beraberinde çevrimiçi kurs, PDF kılavuzu ve özel gruba erişim almak için MQL5 üzerinden bana mesaj gönderin. Piyasayı tarayın. Kurulumları karşılaştırın. Sonraki grafiği seçin. Axiom Matrix (MetaTrader 5), çoklu sembol ve zaman dilimi analizini tek panelde birleştirir. Her grafiği ayrı incelemeden nereye odaklanacağınızı bulun. Piyasa Gözlemi veya seçtiğiniz sembolleri birden fazla zaman diliminde tarayın. Trend, momentum,
Yazarın diğer ürünleri
RenkoFromRealTicks
Stanislav Korotky
4.67 (3)
This non-trading expert utilizes so called custom symbols feature ( available in MQL API as well) to build renko charts based on history of real ticks of selected standard symbol. RenkoFromRealTicks generates custom symbol quotes, thus you may open many charts to apply different EAs and indicators to the renko. It also transmits real ticks to update renko charts in real time. The generated renko chart uses M1 timeframe. It makes no sense to switch the renko chart to a timeframe other than M1. T
AutomaticZigZag
Stanislav Korotky
4.5 (2)
This is a non-parametric ZigZag providing 4 different methods of calculation. Upward edge continues on new bars while their `highs` are above highest `low` among previous bars, downward edge continues on next bars while their `lows` are below lowest `high` among previous; Gann swing: upward edge continues while `highs` and `lows` are higher than on the left adjacent bar, downward edge continues while `highs` and `lows` are lower than on the left adjacent bar. Inside bars (with lower `high` and
FREE
CustomVolumeDelta
Stanislav Korotky
5 (1)
This indicator displays volume delta (of either tick volume or real volume) encoded in a custom symbol, generated by special expert advisers, such as RenkoFromRealTicks . MetaTrader does not allow negative values in the volumes, this is why we need to encode deltas in a special way, and then use CustomVolumeDelta indicator to decode and display the deltas. This indicator is applicable only for custom instruments generated in appropriate way (with signed volumes encoded). It makes no sense to ap
FREE
This is a demo version of a non-trading expert , which utilizes so called the custom symbols feature ( available in MQL as well ) to build renko charts based on historical quotes of selected standard symbol and to refresh renko in real-time according to new ticks. Also it translates real ticks to the renko charts, which allows other EAs and indicators to trade and analyze renko. Place the EA on a chart of a working instrument. The lesser timeframe of the source chart is, the more precise resulti
FREE
WalkForwardDemo is an expert adviser (EA) demonstrating how the built-in library WalkForwardOptimizer (WFO) for walk-forward optimization works. It allows you to easily optimize, view and analyze your EA performance and robustness in unknown trading conditions of future. You may find more details about walk-forward optimization in Wikipedia . Once you have performed optimization using WFO, the library generates special global variables (saved in an "archived" file with GVF-extension) and a CSV-f
FREE
OrderBook Utilities is a script, which performs several service operations on order book hob-files, created by OrderBook Recorder . The script processes a file for work symbol of the current chart. The file date is selected by means of the input parameter CustomDate (if it's filled in) or by the point where the script is dropped on the chart. Depending from the operation, useful information is written into the log, and optionally new file is created. The operation is selected by the input parame
FREE
HZZM
Stanislav Korotky
4 (1)
This is an adaptive ZigZag based on modification of  HZZ indicator (original source code is available in this article ). Most important changes in this version: two additional indicator buffers added for zigzag evolution monitoring - they show cross signs at points where zigzag direction first changes; zigzag range (H) autodetection on day by day basis; time-dependent adjustment of zigzag range. Parameters: H - zigzag range in points; this parameter is similar to original HZZ, but it can take 0
FREE
PointsVsBars
Stanislav Korotky
This indicator provides a statistical analysis of price changes (in points) versus time delta (in bars). It calculates a matrix of full statistics about price changes during different time periods, and displays either distribution of returns in points for requested bar delta, or distribution of time deltas in bars for requested return. Please, note, that the indicator values are always a number of times corresponding price change vs bar delta occurred in history. Parameters: HistoryDepth - numbe
FREE
ReturnAutoScale
Stanislav Korotky
5 (2)
The indicator calculates running total of linear weighted returns. It transforms rates into integrated and difference-stationary time series with distinctive buy and sell zones. Buy zones are shown in blue, sell zones in red. Parameters: period - number of bars to use for linear weighted calculation; default value - 96; smoothing - period for EMA; default value - 5; mode - an integer value for choosing calculation mode: 0 - long term trading; 1 - medium term trading; 2 - short term trading; defa
FREE
Order Book, known also as Market Book, market depth, Level 2, - is a dynamically updated table with current volumes of orders to buy and to sell specific financial instument at price levels near Bid and Ask. MetaTrader 5 provides the means for receiving market book from your broker, but in real time only, without access to its history. This expert adviser OrderBook History Playback allows you to playback the market book events on the history using files, created by OrderBook Recorder . The exper
FREE
Comparator
Stanislav Korotky
4.75 (4)
This indicator compares the price changes during the specified period for the current symbol and other reference symbol. It allows to analyze the similar movements of highly correlated symbols, such as XAUUSD and XAGUSD, and find their occasional convergences and divergences for trading opportunities. The indicator displays the following buffers: light-green thick line - price changes of the current symbol for TimeGap bars; light-blue thin line - price changes of the reference symbol ( LeadSymbo
FREE
This script allows performing a walk-forward analysis of trading experts based on the data collected by the WalkForwardLight MT5 library. The script builds a cluster walk forward report and rolling walk forward reports that refine it, in the form of a single HTML page. This script is optional, as the library automatically generates the report immediate after the optimization in the tester is complete. However, the script is convenient because it allows using the same collected data to rebuild th
FREE
Year2Year
Stanislav Korotky
This indicator shows price changes for the same days in past years. D1 timeframe is required. This is a predictor indicator that finds D1 bars for the same days in past 8 years and shows their relative price changes on the current chart. Parameters: LookForward - number of days (bars) to show "future" price changes; default is 5; Offset - number of days (bars) to shift back in history; default is 0; ShowAverage - mode switch; true - show mean value for all 8 years and deviation bounds; false - s
FREE
Order Book, known also as Market Book, market depth, Level 2, - is a dynamically updated table with current volumes of orders to buy and to sell specific financial instument at price levels near Bid and Ask. MetaTrader 5 provides the means for receiving market book from your broker in real time. The expert OrderBook Recorder records market book changes and stores them in local files for further usage in indicators and expert adviser, including testing in the tester. The expert stores market book
FREE
SOMFX1Builder
Stanislav Korotky
5 (1)
If you like trading by candle patterns and want to reinforce this approach by modern technologies, this script is for you. In fact, it is a part of a toolbox, that includes a neural network engine implementing Self-Organizing Map (SOM) for candle patterns recognition, prediction, and provides you with an option to explore input and resulting data. The toolbox contains: SOMFX1Builder  - this script for training neural networks; it builds a file with generalized data about most characteristic pric
FREE
Mirror
Stanislav Korotky
This indicator predicts rate changes based on the chart display principle. It uses the idea that the price fluctuations consist of "action" and "reaction" phases, and the "reaction" is comparable and similar to the "action", so mirroring can be used to predict it. The indicator has three parameters: predict - the number of bars for prediction (24 by default); depth - the number of past bars that will be used as mirror points; for all depth mirroring points an MA is calculated and drawn on the ch
If you like trading crosses (such as AUDJPY, CADJPY, EURCHF, and similar), you should take into account what happens with major currencies (especially, USD and EUR) against the work pair: for example, while trading AUDJPY, important levels from AUDUSD and USDJPY may have an implicit effect. This indicator allows you to view hidden levels, calculated from the major rates. It finds nearest extremums in major quotes for specified history depth, which most likely form resistence or support levels, a
EvoLevels
Stanislav Korotky
The indicator displays most prominent price levels and their changes in history. It dynamically detects regions where price movements form attractors and shows up to 8 of them. The attractors can serve as resistance or support levels and outer bounds for rates. Parameters: WindowSize - number of bars in the sliding window which is used for detection of attractors; default is 100; MaxBar - number of bars to process (for performance optimization); default is 1000; when the indicator is called from
This is an intraday indicator that uses conventional formulae for daily and weekly levels of pivot, resistance and support, but updates them dynamically bar by bar. It answers the question how pivot levels would behave if every bar were considered as the last bar of a day. At every point in time, it takes N latest bars into consideration, where N is either the number of bars in a day (round the clock, i.e. in 24h) or the number of bars in a week - for daily and weekly levels correspondingly. So,
Most of traders use resistance and support levels for trading, and many people draw these levels as lines that go through extremums on a chart. When someone does this manually, he normally does this his own way, and every trader finds different lines as important. How can one be sure that his vision is correct? This indicator helps to solve this problem. It builds a complete set of virtual lines of resistance and support around current price and calculates density function for spatial distributi
The indicator draws a histogram of important levels for several major currencies attached to the current cross rates. It is intended for using on charts of crosses. It displays a histogram calculated from levels of nearest extremums of related major currencies. For example, hidden levels for AUDJPY can be detected by analyzing extremums of AUD and JPY rates against USD, EUR, GBP, and CHF. All instruments built from these currencies must be available on the client. This is an extended version of
StatBars
Stanislav Korotky
The indicator provides a statistic histogram of estimated price movements for intraday bars. It builds a histogram of average price movements for every intraday bar in history, separately for each day of week. Bars with movements above standard deviation or with higher percentage of buys than sells, or vice versa, can be used as direct trading signals. The indicator looks up current symbol history and sums up returns on every single intraday bar on a specific day of week. For example, if current
This is an easy to use signal indicator which shows and alerts probability measures for buys and sells in near future. It is based on statistical data gathered on existing history and takes into account all observed price changes versus corresponding bar intervals in the past. The statistical calculations use the same matrix as another related indicator - PointsVsBars. Once the indicator is placed on a chart, it shows 2 labels with current estimation of signal probability and alerts when signal
CCFpExtra
Stanislav Korotky
CCFpExtra is an extended version of the classic cluster indicator - CCFp. This is the MT4 version of indicator  CCFpExt available for MT5. Despite the fact that MT5 version was published first, it is MT4 version which was initially developed and tested, long before MT4 market was launched. Main Features Arbitrary groups of tickers or currencies are supported: can be Forex, CFDs, futures, spot, indices; Time alignment of bars for different symbols with proper handling of possibly missing bars, in
This is a signal indicator for automatic trading which shows probability measures for buys and sells for each bar. It is based on statistical data gathered on existing history and takes into account all observed price changes versus corresponding bar intervals in the past. The core of the indicator is the same as in PriceProbablility indicator intended for manual trading. Unlike PriceProbability this indicator should be called from MQL4 Expert Advisors or used for history visual analysis. The in
The main idea of this indicator is rates analysis and prediction by Fourier transform. Indicator decomposes exchange rates into main harmonics and calculates their product in future. You may use the indicator as a standalone product, but for better prediction accuracy there is another related indicator - FreqoMaster - which uses FreqoMeterForecast as a backend engine and combines several instances of FreqoMeterForecast for different frequency bands. Parameters: iPeriod - number of bars in the ma
FreqoMaster
Stanislav Korotky
The main idea of this indicator is rates analysis and prediction by Fourier transform. The indicator decomposes exchange rates into main harmonics and calculates their product in future. The indicator shows 2 price marks in history, depicting price range in the past, and 2 price marks in future with price movement forecast. Buy or sell decision and take profit size are displayed in a text label in the indicator window. The indicator uses another indicator as an engine for calculations - FreqoMet
This is a very powerful indicator that provides a mix of three running totals of linear weighted returns. Each one is similar to a specific mode of ReturnAutoScale indicator. The result is a scaled superposition of three integrated and difference-stationary time series, each for different trading strategy. Indicator displays three lines: yellow - slow market returns, corresponds to mode 0 in ReturnAutoScale; blue - medium market returns, corresponds to mode 1 in ReturnAutoScale; red - fast marke
This indicator monitors the market for a flat state and possible breakout. The flat state is detected as a predefined number of consecutive bars during which price fluctuates inside a small range. If one of the next bars closes outside the range, breakout is signaled. The indicator shows 3 lines: blue - upper bound of flat ranges AND consecutive breakout areas; red - lower bound of flat ranges AND consecutive breakout areas; yellow - center of flat ranges (NOT including breakout areas). When a b
This indicator predicts next ZigZag move based on historical ZigZag edges probabilities. It processes available history for calculating density distribution of ZigZag edges and conditional probability of their consecutive pairs. Then it uses the probabilities for estimating levels where future extremums (reversal points) may appear. This indicator builds zigzag by HZZM indicator , but does not display zigzag itself. You may use HZZM for zigzag visualization. The indicator displays up to 8 horizo
Filtrele:
Değerlendirme yok
Değerlendirmeye yanıt