Fibonacci Waves MT5
- Indicadores
- Versión: 4.8
- Actualizado: 20 noviembre 2021
- Activaciones: 5

La serie de Fibonacci. Esta secuencia numérica se forma como cada número subsiguiente es una suma de los dos anteriores.
Resulta que se refiere a sus vecinos en la relación 0,618 y 1,618.
El método más utilizado para medir y pronosticar la longitud del movimiento del precio es a lo largo de la última onda, que terminó en la dirección opuesta
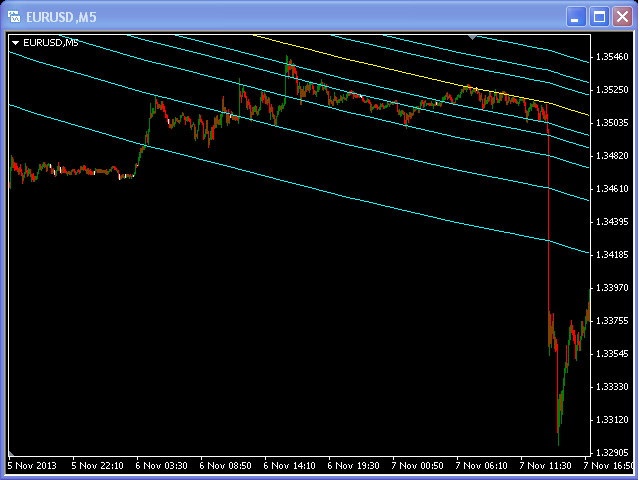
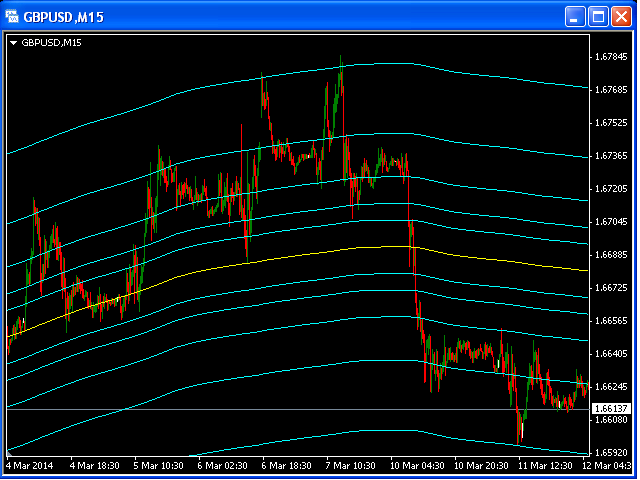
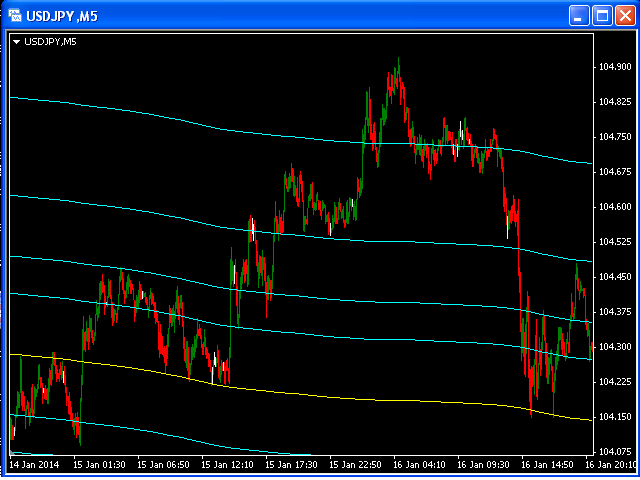
El indicador de las Ondas de Fibonacci podría ser utilizado por los operadores para determinar las zonas en las que desearán tomar beneficios en el siguiente tramo de una tendencia alcista o bajista.