Fractals Dashboard MT5
- Indicadores
- Versión: 4.50
- Actualizado: 19 julio 2026
- Activaciones: 10

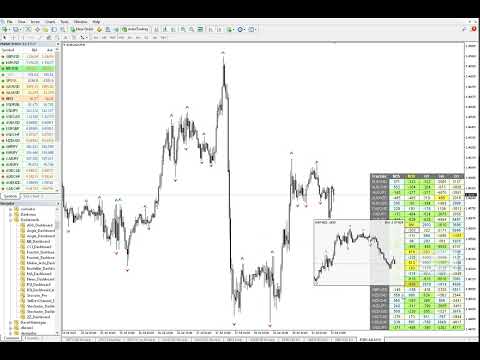
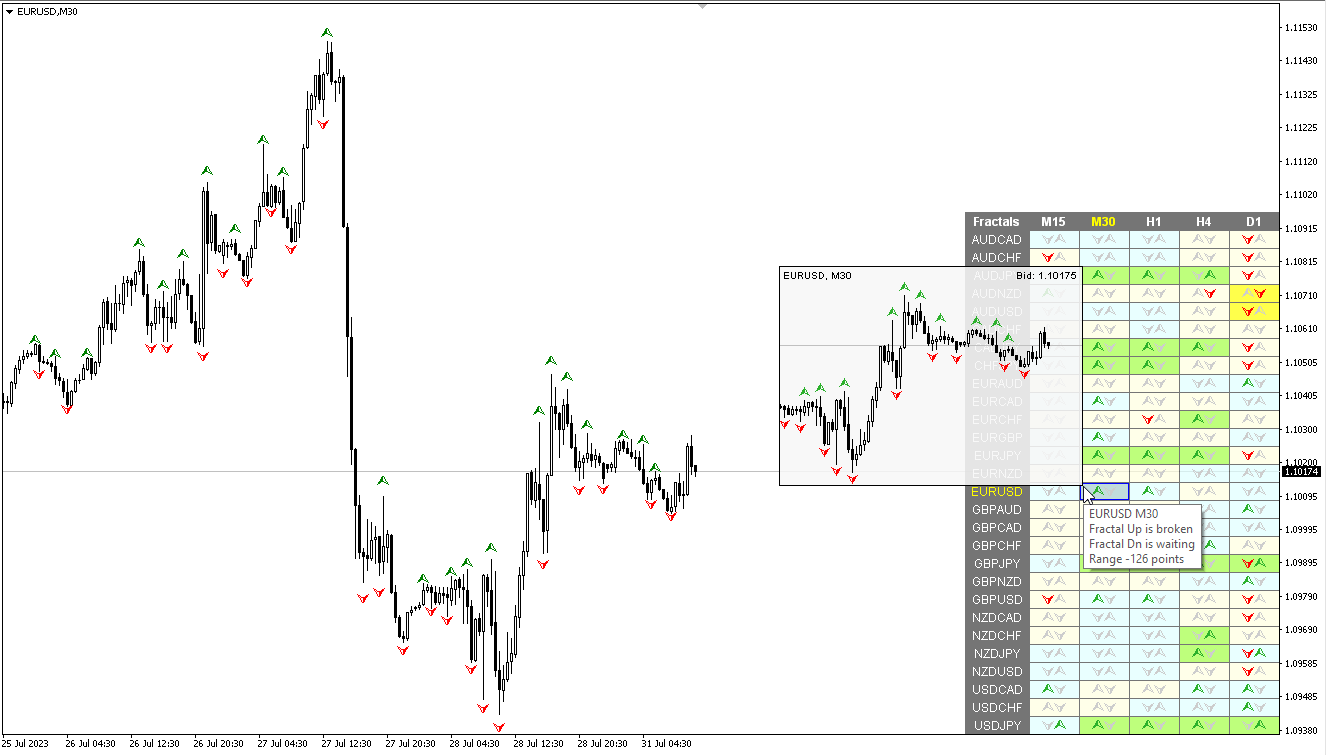
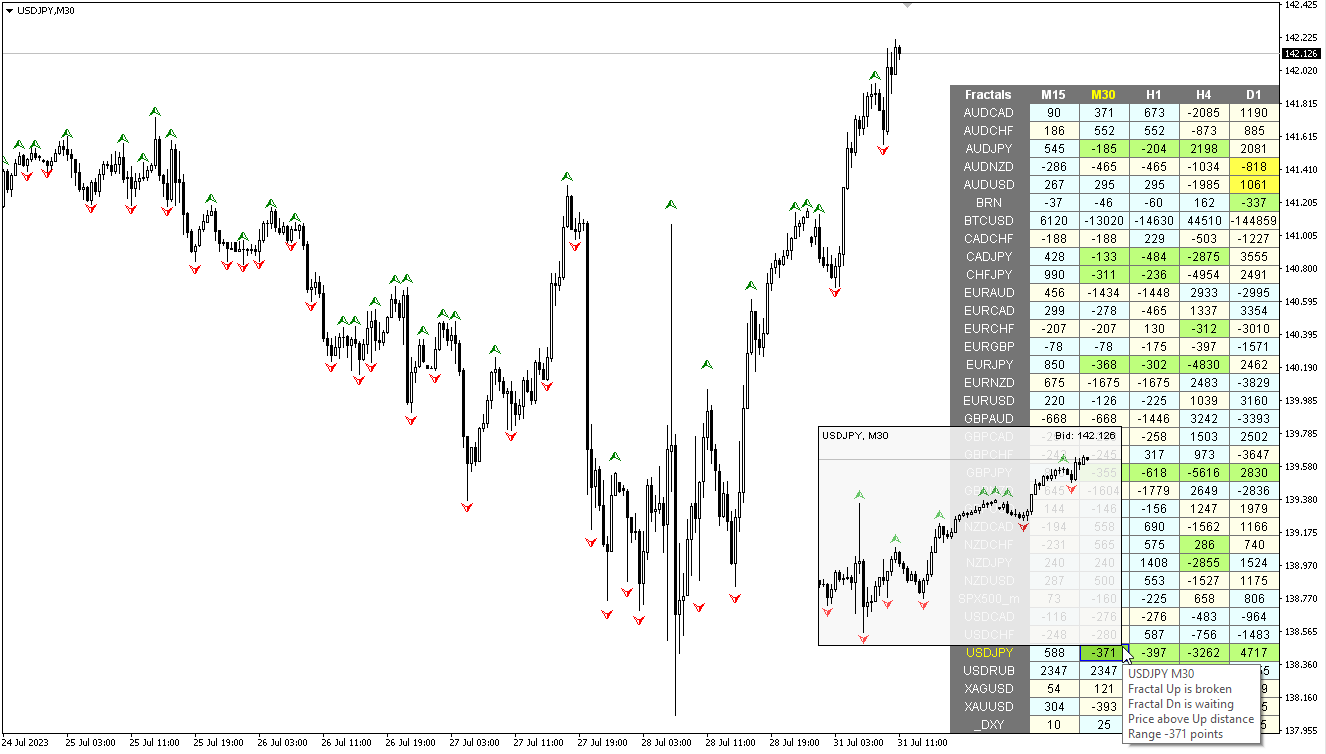
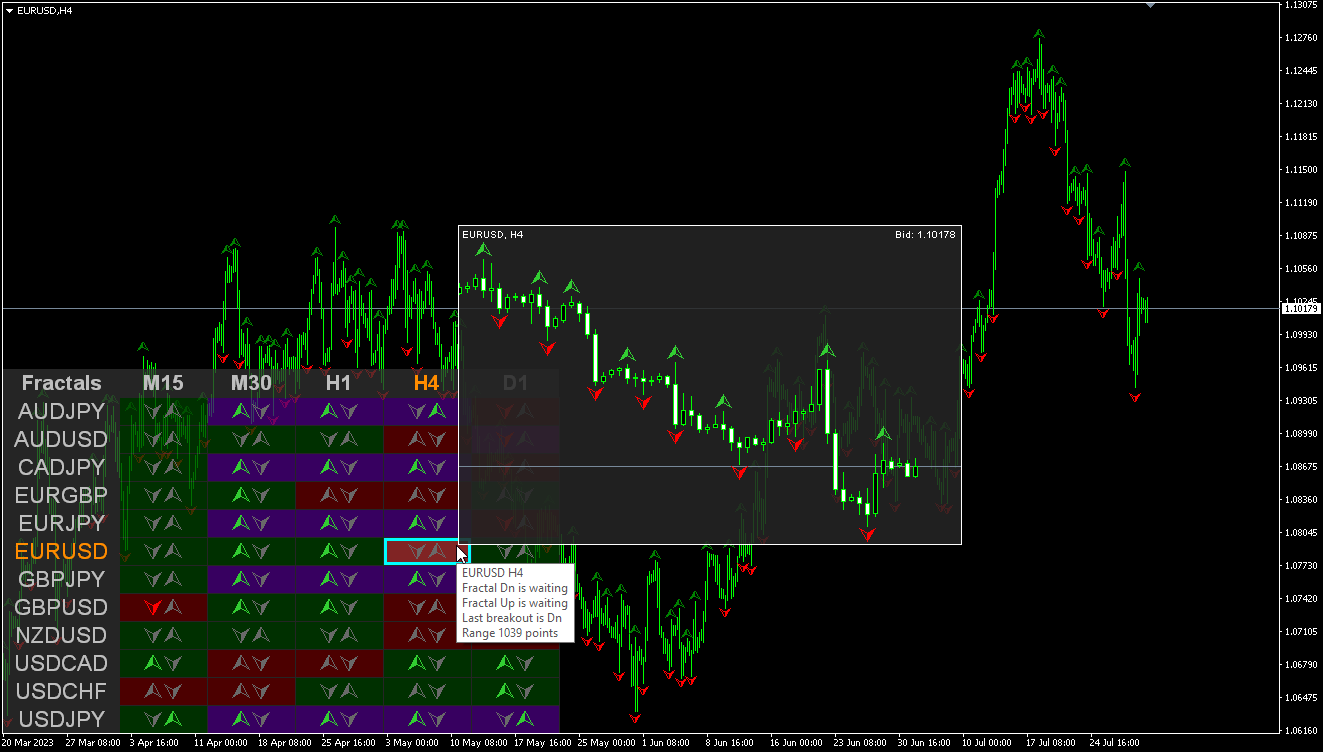
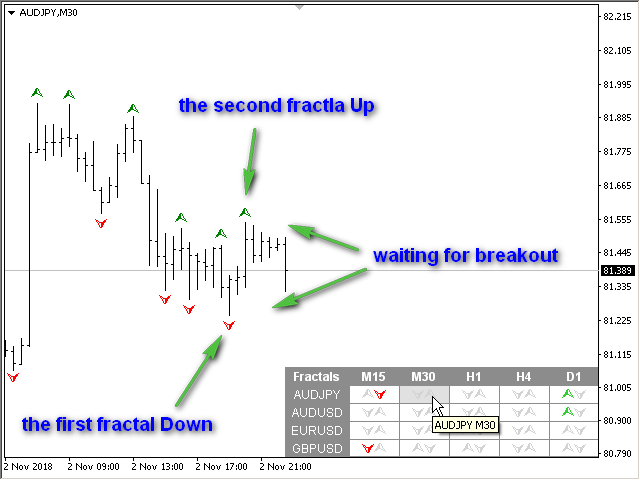
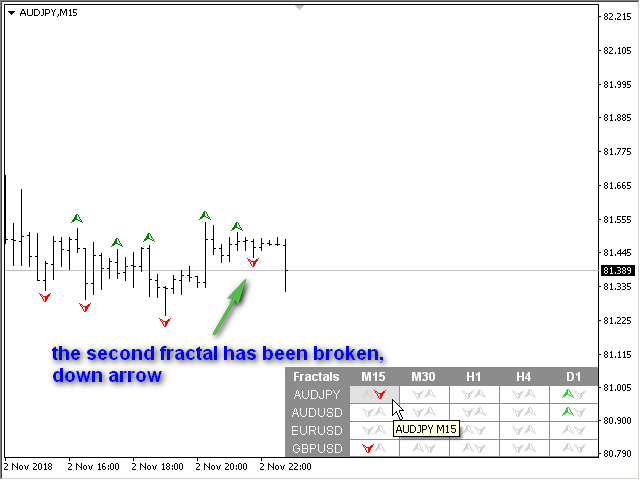
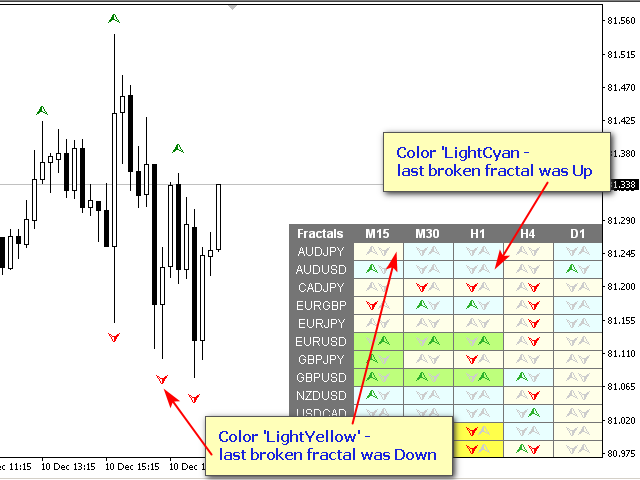
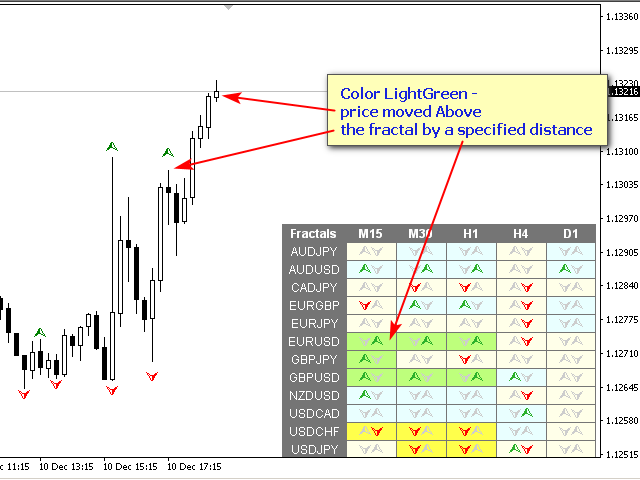
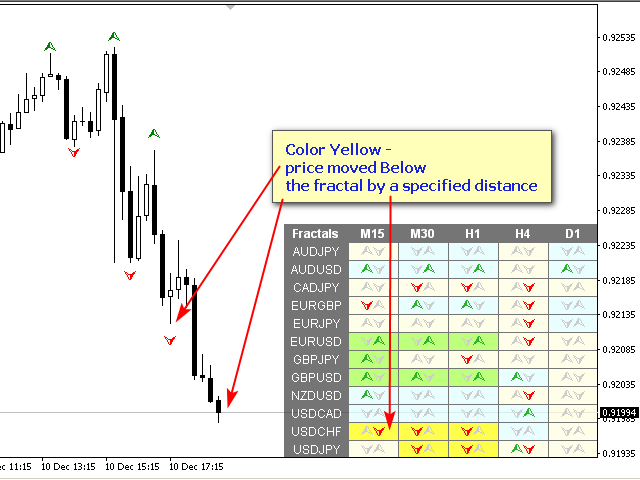
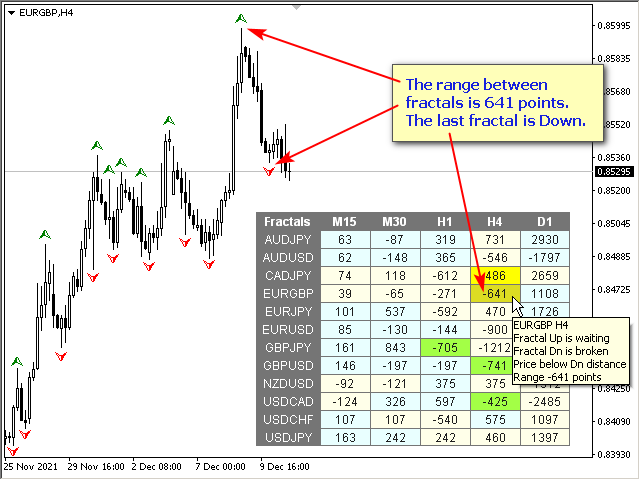
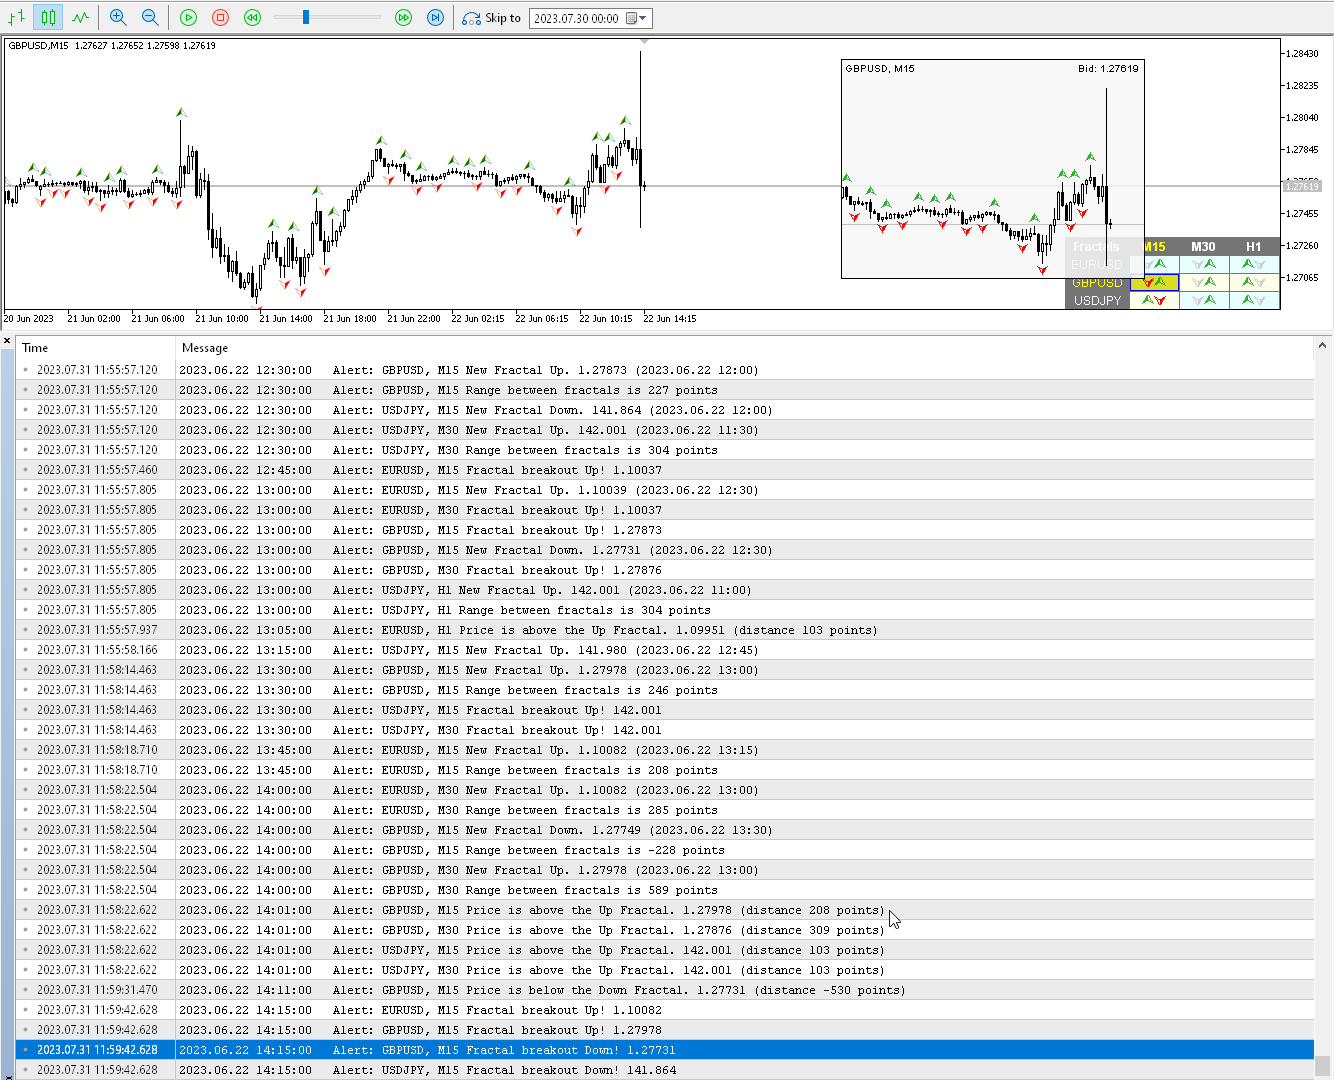
Modificación multidivisa y multitemporal del indicador Fractales. Muestra los dos últimos fractales: su secuencia (y cuál está roto) o la distancia entre ellos. Puede especificar las monedas y plazos que desee en los parámetros. Además, el panel puede enviar notificaciones sobre la ruptura de un fractal. Al hacer clic en una celda con un punto, se abrirá este símbolo y punto. Este es el escáner MTF.
La clave para ocultar el panel del gráfico es "D" de forma predeterminada
Parámetros
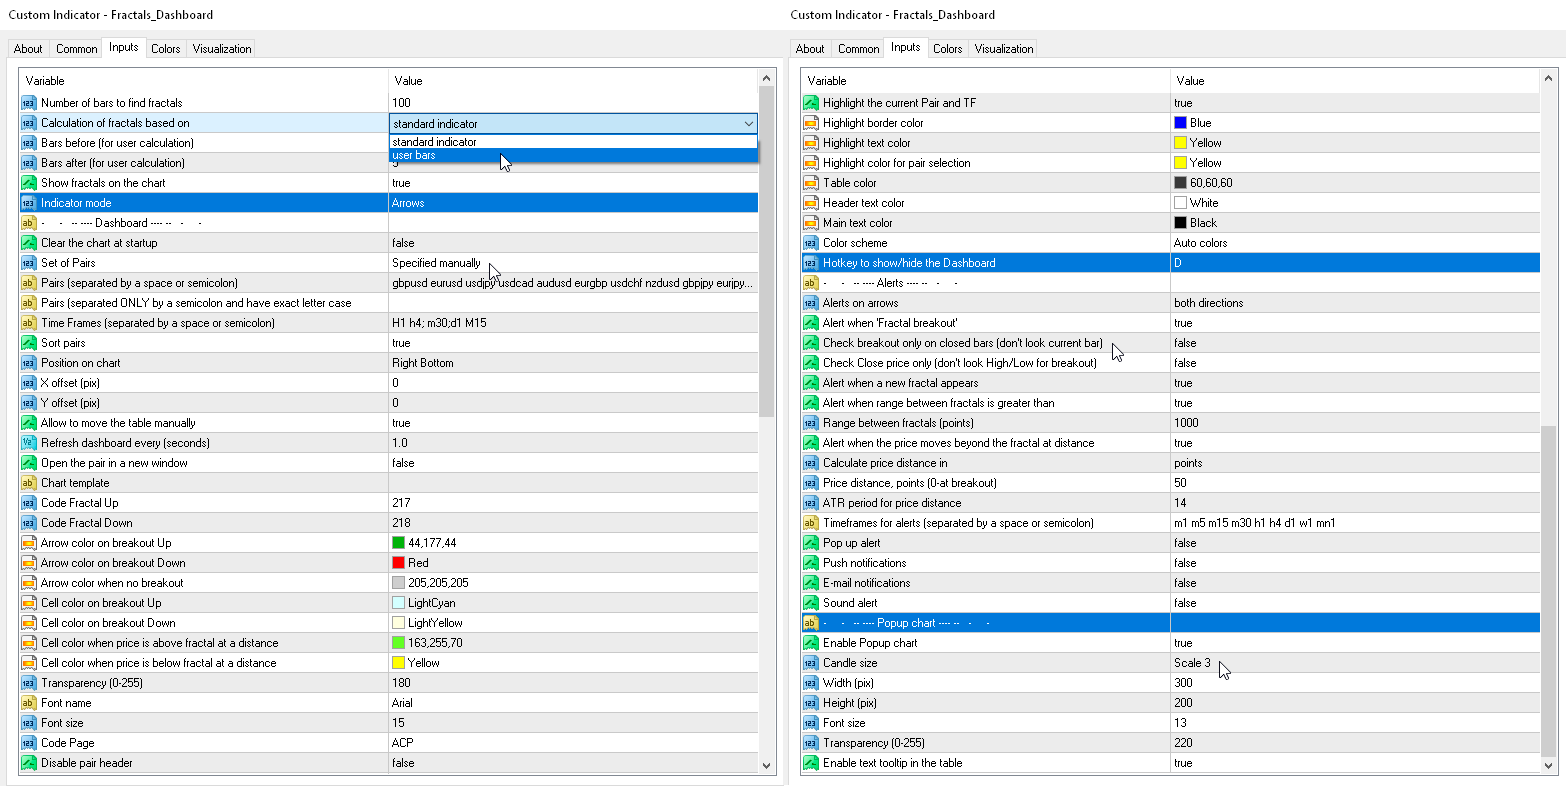
Calculation of fractals based on — modo de búsqueda de fractales;
— standart indicator — mediante el indicador estándar;— user bars — por el número de barras personalizadas (fractal ajustable);
Bars before (user calc) — el número de barras antes del fractal
Bars after (user calc) — el número de barras después del fractal;
Indicator mode — modos de visualización
— Arrows — las dos últimas flechas de los fractales;— Distance — distancia entre los dos últimos fractales;
Show fractals on the chart — muestra los fractales actuales en el gráfico;
Clear the chart at startup — borre el gráfico al inicio.
Set of Pairs — conjunto de símbolos
— Market Watch — Pares del "Market Watch" del MT.— Specified manually — pares especificados manualmente, en los parámetros "Pares".— Current pair — muestra solo el par actual.
Pairs (separated by a space or semicolon) — lista de símbolos separados por espacios o punto y coma. Los nombres de las monedas deben escribirse exactamente como los del broker, manteniendo las mayúsculas y minúsculas y el prefijo/sufijo.
Time Frames (separated by a space or semicolon) — lista de períodos de tiempo separados por espacios o punto y coma (marcos de tiempo múltiples).
Sort pairs — ordenar la lista de pares.
Position on chart — esquina para mostrar el panel en el gráfico.
X offset (pix) — desplaza el panel a lo largo del eje X;
Y offset (pix) — desplaza el panel a lo largo del eje Y;
Refresh dashboard every (seconds) — período de actualización para todos los pares y períodos de tiempo.
Open the pair in a new window — abra un símbolo en una nueva ventana del gráfico haciendo clic.
Chart template — el nombre de la plantilla del gráfico, si el gráfico se abre en una ventana nueva.
Color Up — color de la flecha hacia arriba en el punto de ruptura.
Color Down — color de la flecha hacia abajo en el punto de ruptura.
Color Stop — color de flecha sin avance.
Transparency (0-255) — transparencia del panel.
Font name — nombre de fuente.
Font size — tamaño de fuente.
Code Page — cambia la página de códigos. Si los caracteres en el panel se muestran incorrectamente, pruebe con otras codificaciones (por ejemplo, ACP o UTF7);
Alertas
Alert when a new fractal appears — envía una alerta cuando aparece un nuevo fractal;
Alert when 'Fractal breakout' — envía una alerta cuando el precio haya superado el último fractal;
Check breakout only on closed bars (don't look current bar) — verifique la ruptura fractal solo en barras cerradas;
Check Close price only (don't look High/Low for breakout) — para determinar la ruptura del fractal, solo se tendrá en cuenta el precio de cierre de la barra.
Alert when distance between fractals is greater than — envía una alerta si la distancia entre fractales es mayor que Distancia o igual a Distancia.
Distance (points) — distancia entre fractales.
Timeframes for alerts (separated by a space or semicolon) — lista de períodos durante los cuales se enviará la alerta (separados por un espacio o punto y coma).
Pop up alert — alerta emergente.
Push notifications — notificación push.
E-mail notifications — notificación por correo electrónico.
Sound alert — alerta sonora.

Great dashboard with lots of settings. The author responds to comments and solves problems very quickly.