Fractals Dashboard MT5
- インディケータ
- バージョン: 4.50
- アップデート済み: 19 7月 2026
- アクティベーション: 10

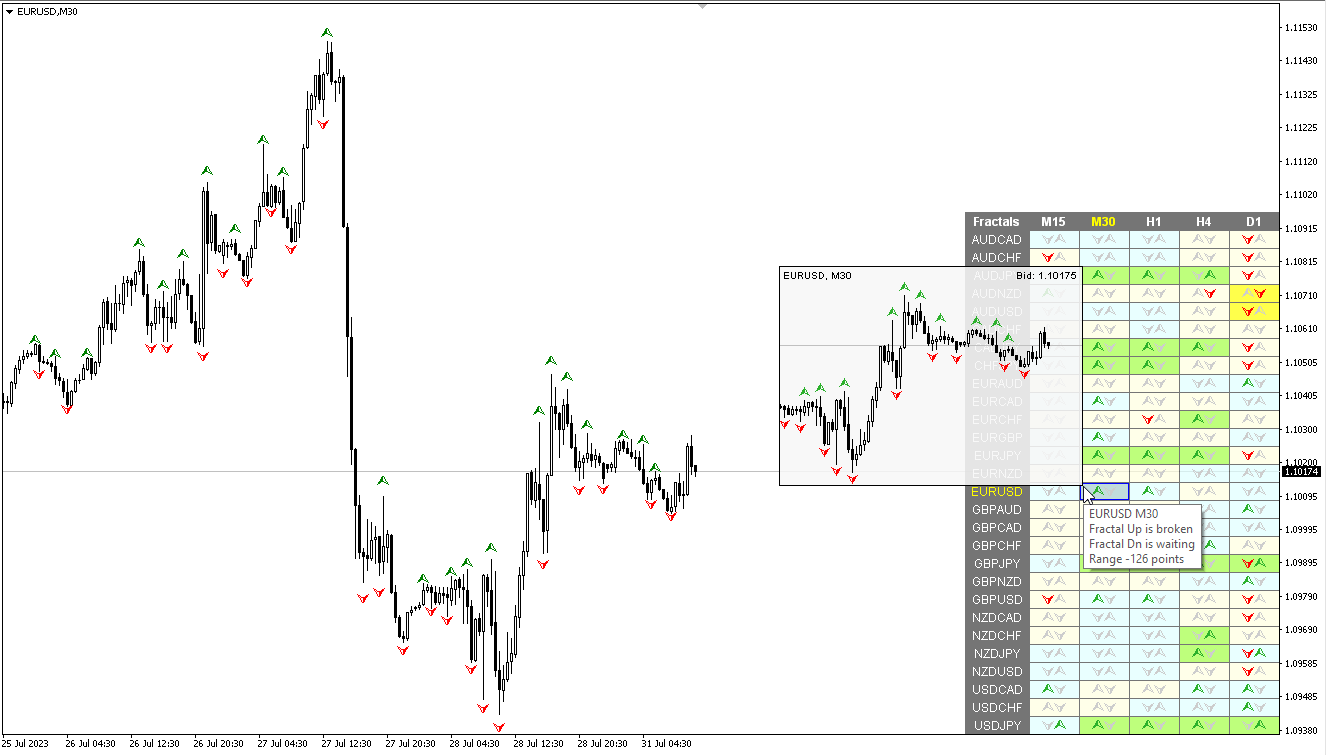
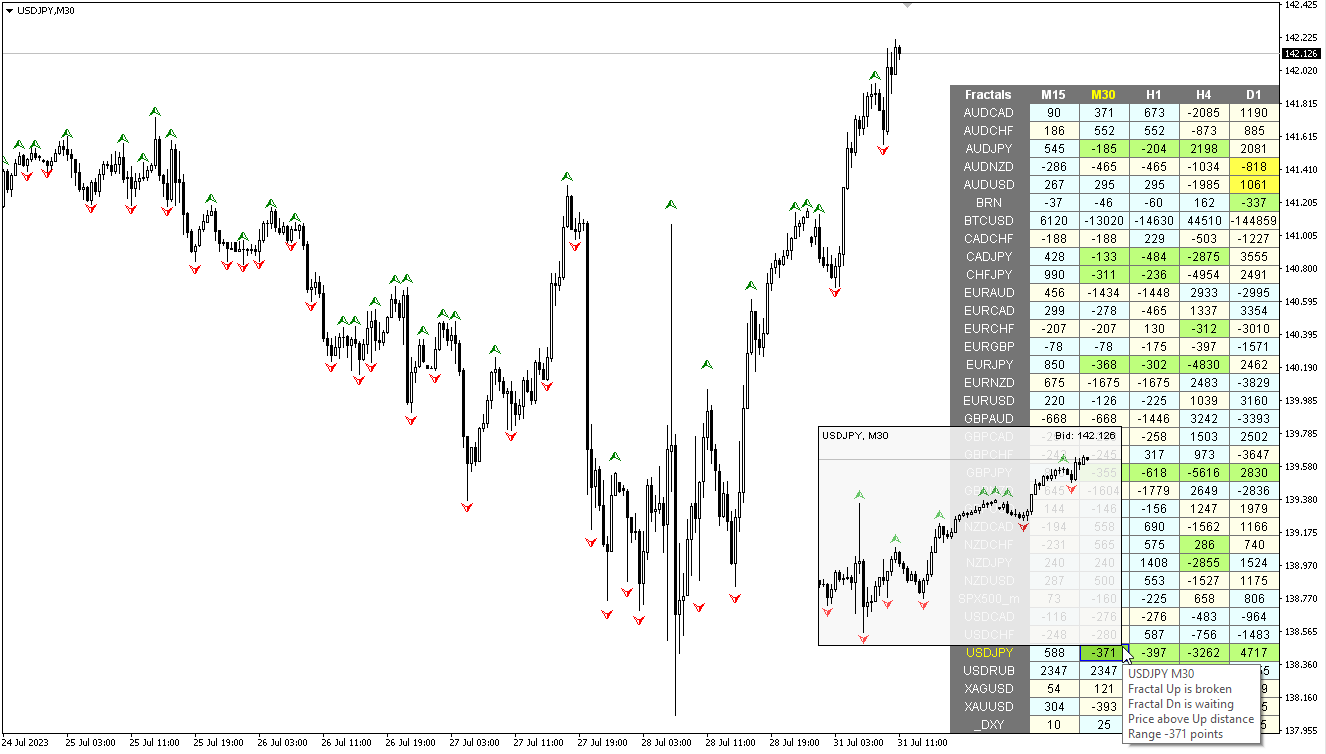
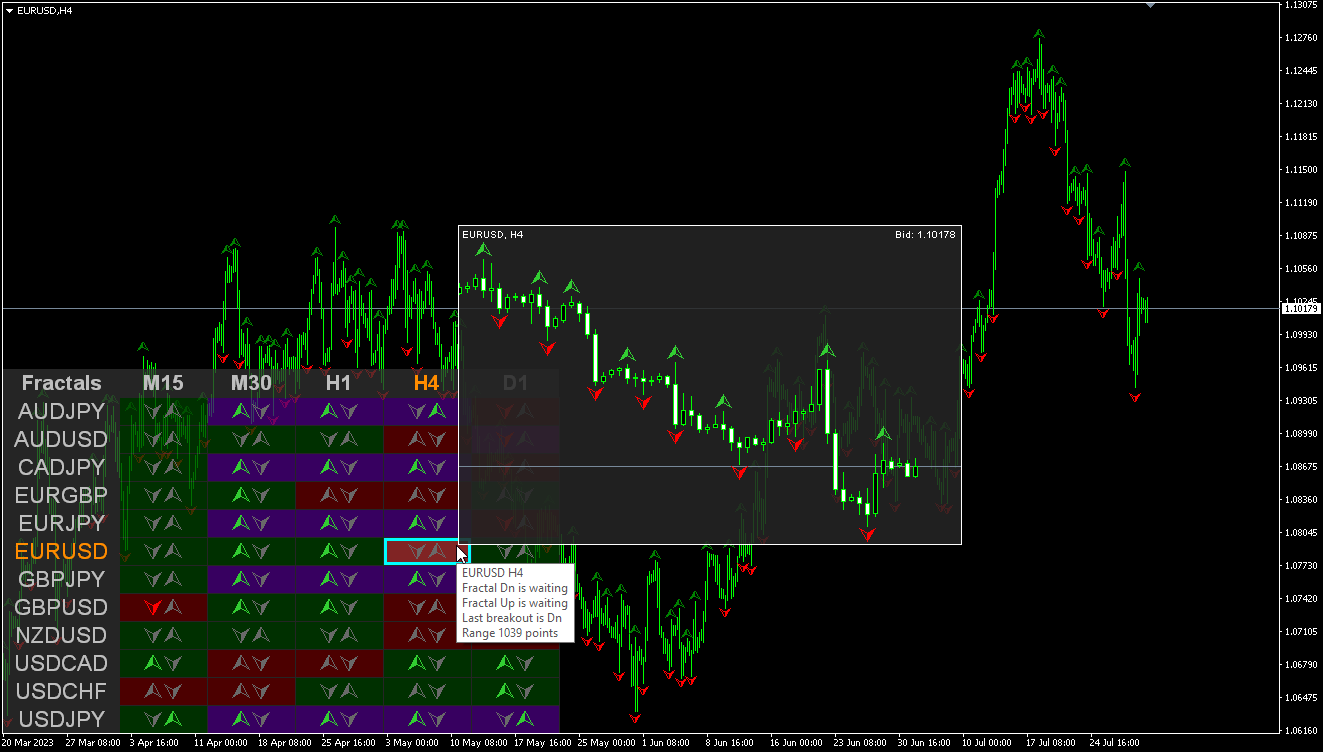
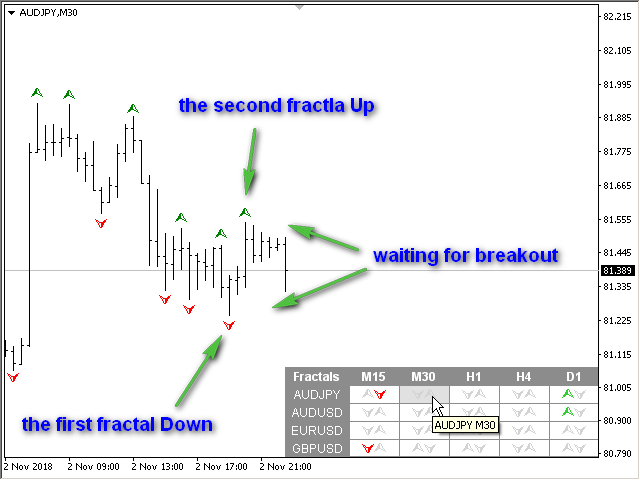
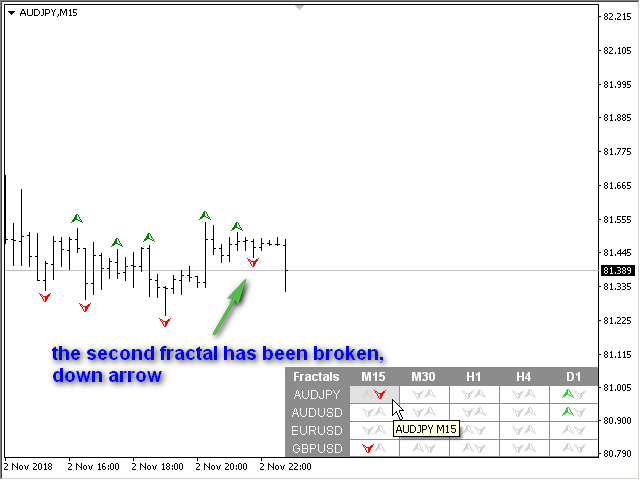
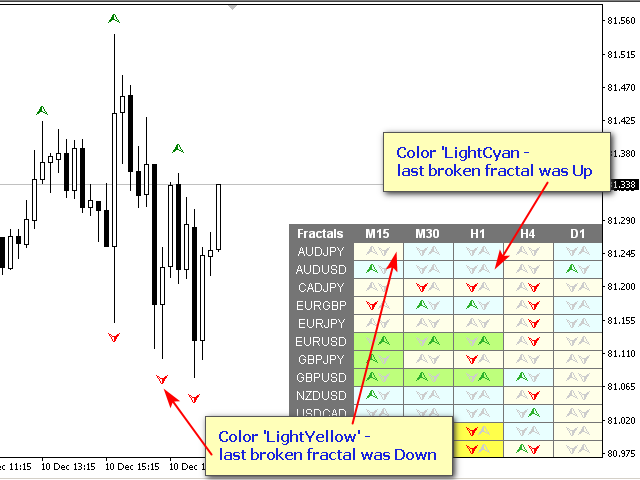
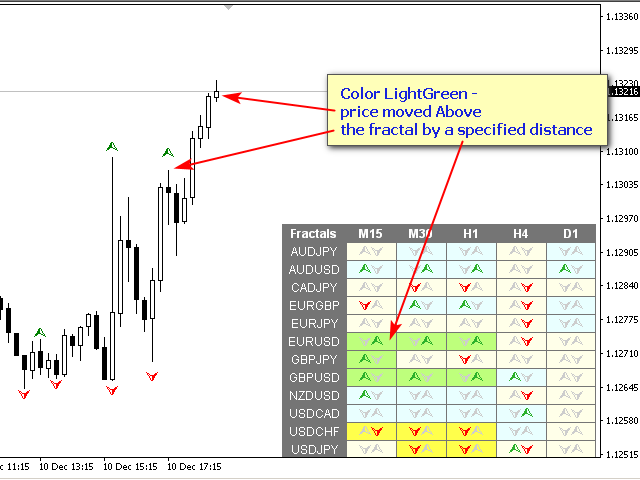
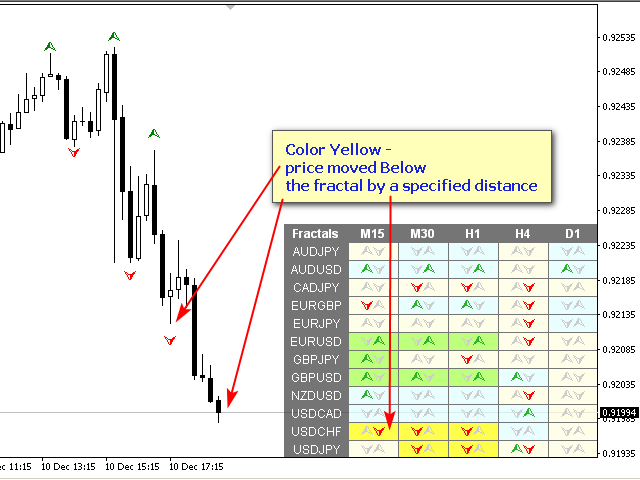
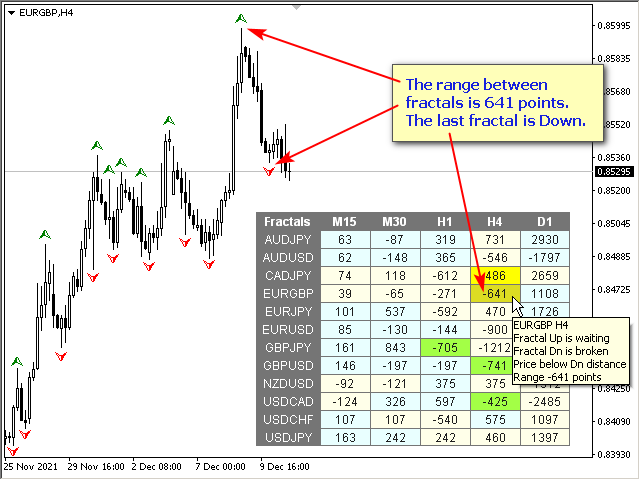
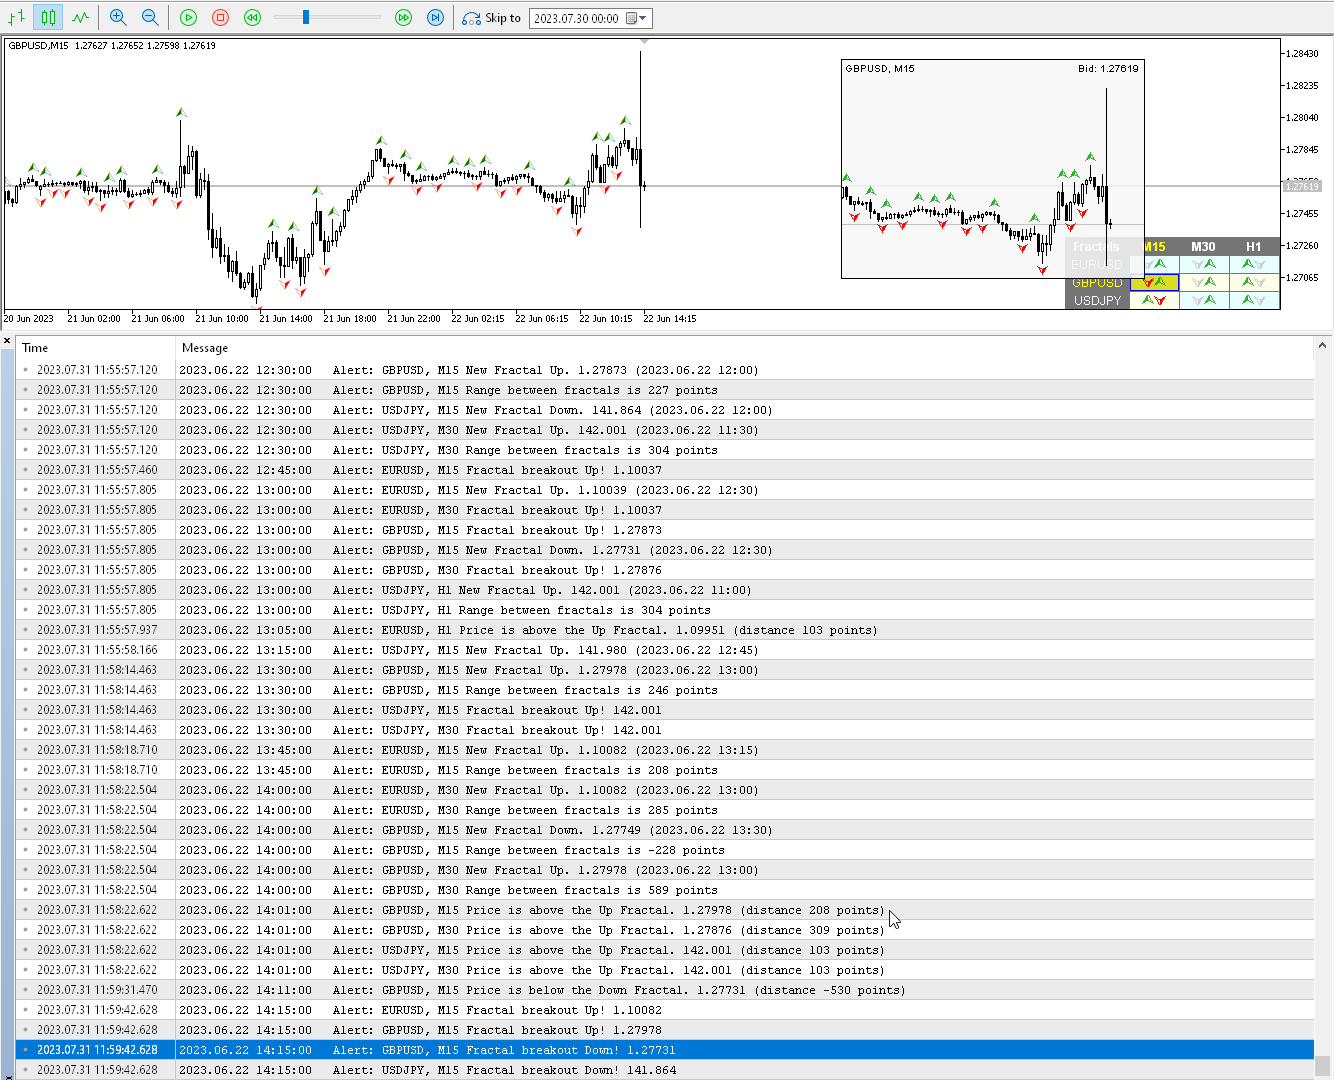
Multicurrency and multitimeframe modification of the Fractals indicator. Displays the last two fractals — their sequence (and which one is broken), or the distance between them. You can specify any desired currencies and timeframes in the parameters. Also, the panel can send notifications on a fractal's breakout. By clicking on a cell with a period, this symbol and period will be opened. This is MTF Scanner.
The key to hide the dashboard from the chart is "D" by default
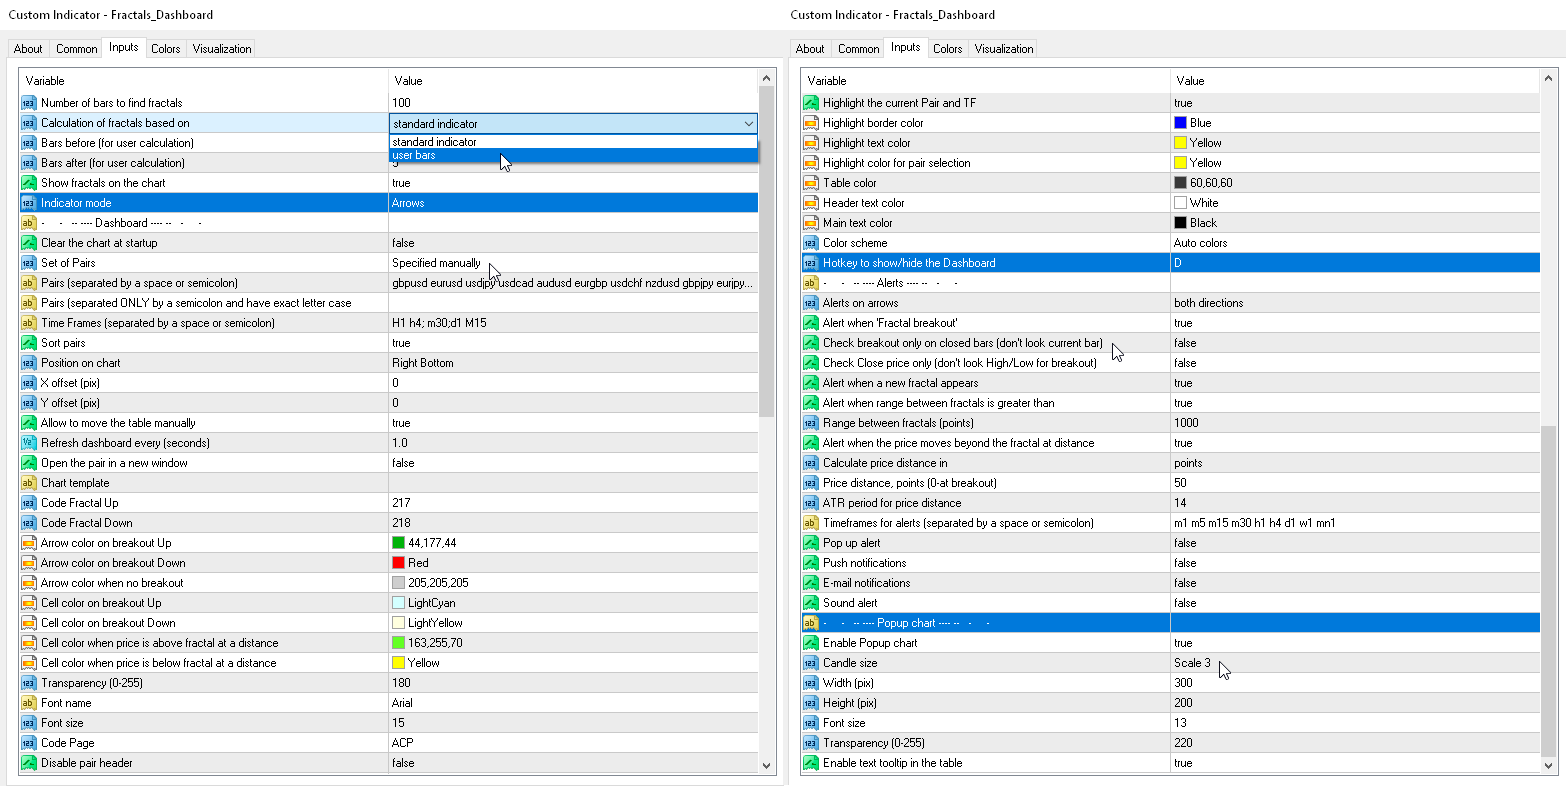
Parameters
Calculation of fractals based on — fractal search mode:— standart indicator — by the standard indicator;
— user bars — by the number of custom bars (adjustable fractal);
Bars after (user calc) — the number of bars after the fractal;
Indicator mode — display modes
— Arrows — the last two arrows of fractals;
— Distance — distance between the last two fractals;
Clear the chart at startup — clear the chart at startup.
Set of Pairs — set of symbols
— Market Watch — pairs from the "Market Watch" of the MT.
— Specified manually — pairs specified manually, in the parameters "Pairs".
— Current pair — show only the current pair.
Time Frames (separated by a space or semicolon) — list of timeframes separated by spaces or semicolons (multi timeframe).
Sort pairs — sorting the list of pairs.
Position on chart — corner to display the panel on the chart.
X offset (pix) — shift the panel along the X axis;
Y offset (pix) — shift the panel along the Y axis;
Refresh dashboard every (seconds) — update period for all pairs and timeframes.
Open the pair in a new window — open a symbol in a new chart window by clicking.
Chart template — the name of the template for the chart, if the chart opens in a new window.
Color Up — up arrow color at breakout.
Color Down — down arrow color at breakout.
Color Stop — arrow color without breakthrough.
Transparency (0-255) — transparency of the panel.
Font name — font name.
Font size — font size.
Code Page — change the code page. If the characters on the panel are displayed incorrectly, try other encodings (e.g. ACP or UTF7);
Alerts
Alert when a new fractal appears — send an alert when a new fractal appears;
Alert when 'Fractal breakout' — send an alert when the price has passed the last fractal;
Check breakout only on closed bars (don't look current bar) — check fractal breakdown only on closed bars;
Check Close price only (don't look High/Low for breakout) — to determine the breakout of the fractal, only the bar's close price will be taken into account.
Alert when distance between fractals is greater than — send an alert if the distance between fractals is greater than Distance or equal to Distance.
Distance (points) — distance between fractals.
Timeframes for alerts (separated by a space or semicolon) — list of periods for which the alert will be sent (separated by a space or semicolon).
Pop up alert — pop-up alert.
Push notifications — push notification.
E-mail notifications — e-mail notification.
Sound alert — sound alert.

Great dashboard with lots of settings. The author responds to comments and solves problems very quickly.