ZigZag on average for MQL5
- Indicadores
- Versión: 1.3
- Actualizado: 14 junio 2021
- Activaciones: 10

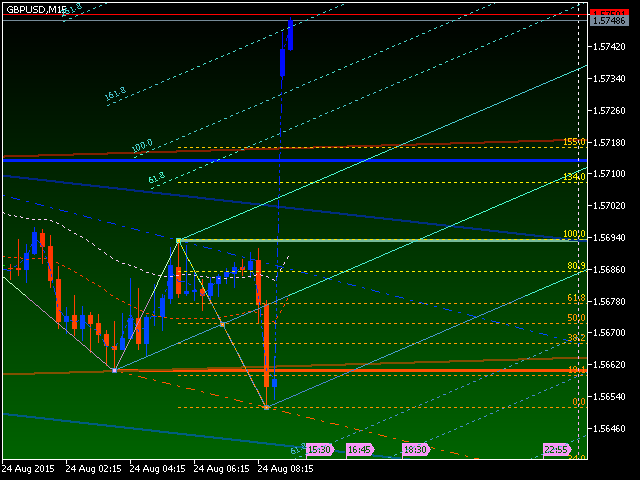
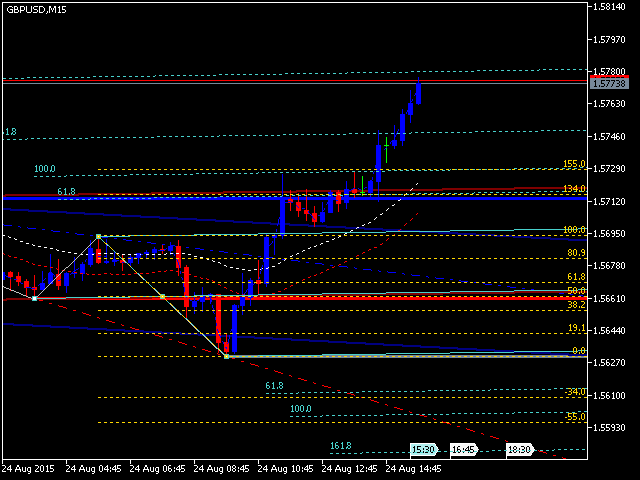
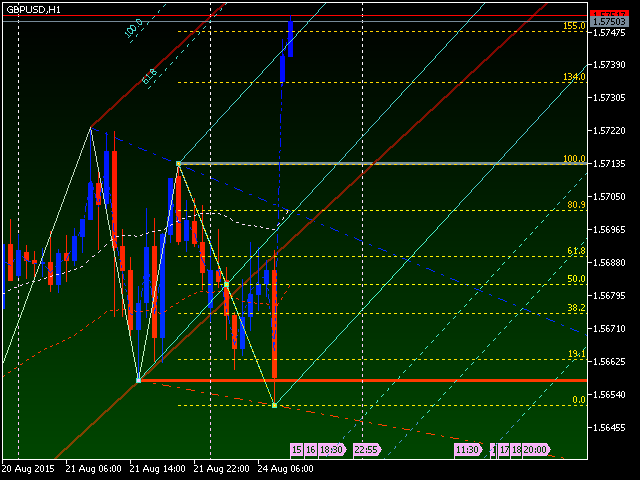
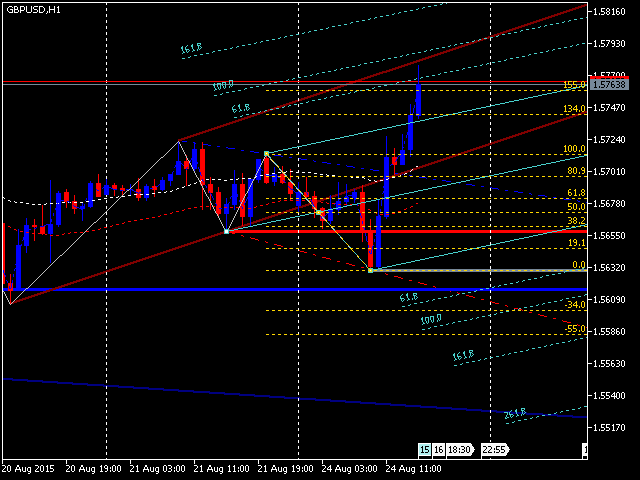
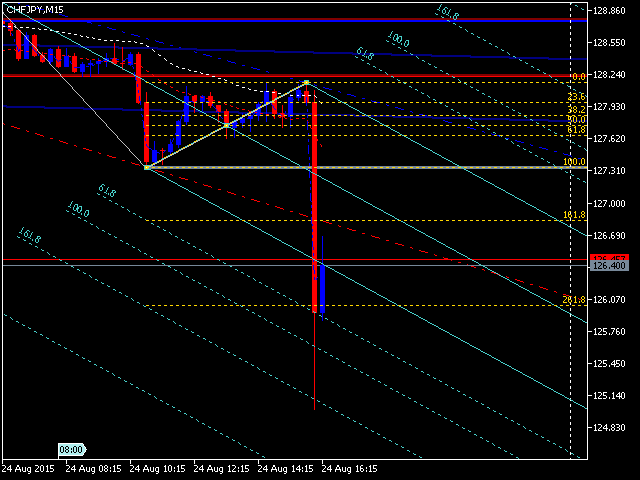
Se trata de un conocido indicador ZigZag. Pero se diferencia por el hecho de que su trama se basa en los valores de la línea media que se establece por un usuario. Puede mostrar los niveles Pitchfork de Andrews y Fibo estándar o Bobokus. NO SE REPINTAN.
Parámetros
- Período МА - período de la línea media. Valor por defecto es 34. Valor mínimo es 4. Valor máximo se establece a su discreción.
- Utilizado para calcular el precio - tipo de precio utilizado para los cálculos de la línea media.
- El método de promedio - tipo de suavizado para la línea media.
- Turning pitchfork - habilitar (true) o deshabilitar (false) Andrews' Pitchfork.
- PitchColor - color del Pitchfork de Andrews.
- Inclusión niveles Fib o - habilitar (true) o deshabilitar (false) niveles Fibo.
- Instalar niveles Fibo Bobokus - utilizar niveles Fibo Bobokus (true) o niveles Fibo estándar (false).
- Distancia para convertir los niveles Fibo Bobokus - distancia en puntos entre los puntos del último movimiento para visualizar los niveles Fibo Bobokus.
- Color de la zona Fibonacci - color de los niveles Fibo Bobokus.
- switch (OFF) display support and resistance levels - mostrar (ocultar) niveles de soporte y resistencia.
- switch (OFF) display channels support and resistance - mostrar (ocultar) canales de soporte y resistencia.
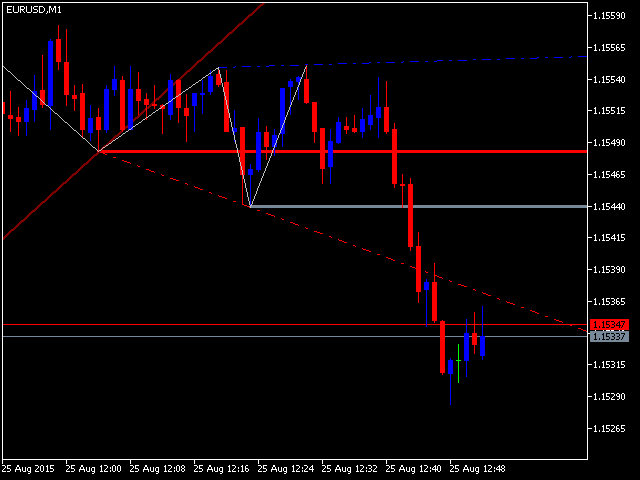
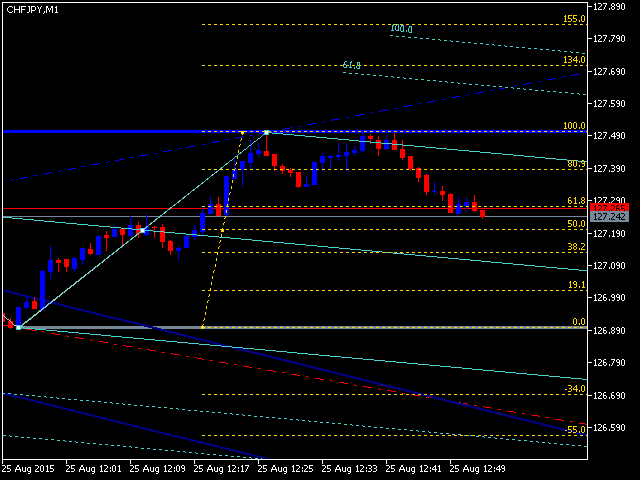
Personalice aquí el esquema de colores y el ancho de las líneas. Tenga en cuenta las siguientes especificaciones de construcción de las líneas de soporte y resistencia. Sólo aparecen donde cambia la dirección de la tendencia, por lo que son un buen asistente para detectar puntos de entrada/salida. Observe también las "huellas" de los canales anteriores, que aparecen como líneas de tendencia cortas en los máximos (mínimos) en zigzag. Este indicador le proporciona más confianza en la toma de decisiones comerciales.


El usuario no ha dejado ningún comentario para su valoración