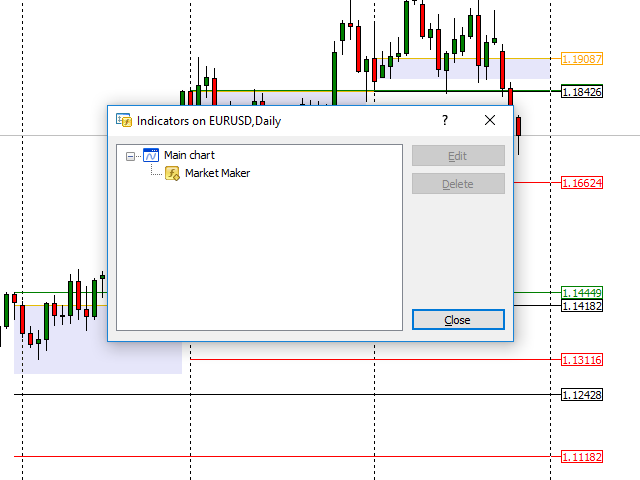
Market Maker
- Indicadores
-
Chantal Sala
 Hi, I'm a programmer (female) from 1995 and in MQL4 from 2008.
I have released most of 2500 Expert Advisor/Indicators and Dashboard.
I have worked with many famous italian traders to automate their strategy. - Versión: 1.1
- Actualizado: 13 octubre 2017
- Activaciones: 10
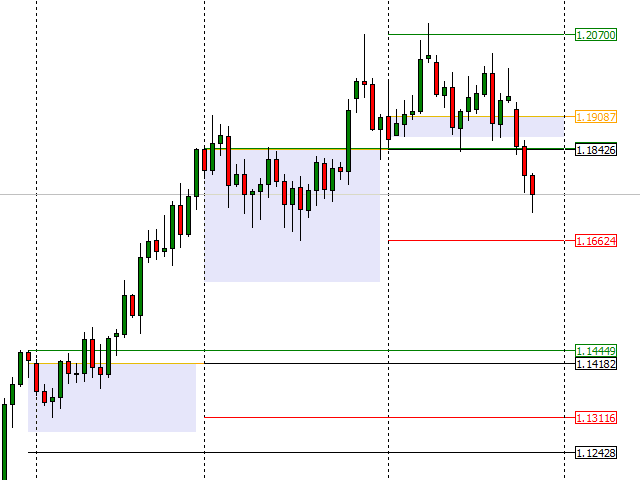
El indicador Market Maker se centra en niveles clave como mínimo, máximo, apertura y cierre de importantes marcos temporales.
Una observación atenta de estos niveles le permitirá identificar la dirección adecuada de la tendencia.
En estos niveles los Market Makers intentan hacer una caza muy de Stop Loss.
Recomendamos utilizar los valores Diarios en el gráfico H1, Semanales en el gráfico H4 y Mensuales en el gráfico D1.
Utilícelo configurando los tres marcos temporales en el mismo gráfico y verá que estos niveles le serán de gran ayuda para encontrar los mejores niveles objetivo.
El indicador representa los mejores niveles con mayor valor estadístico operativo.
Valores de entrada
- CONFIGURACIÓN DEL PERIODO
- TimeFrame Period - qué Time Frame analizar
- Draw for Periods Number - cuántas velas analizar, referirse a Time Frame
- Show NO TRADE ZONE - mostrar o no mostrar el rectángulo de No Trade
- AJUSTES DE COLOR Y ESTILO
- Color Alto - para establecer las líneas de niveles en los niveles Altos
- Low Color - para establecer las líneas de nivel en los niveles bajos.
- Color de apertura anterior: para establecer las líneas de nivel en el precio de apertura anterior.
- Color de apertura: para establecer las líneas de nivel en el precio de apertura.
- Rectangle Color - para establecer los rectángulos de no operación
- Estilo de línea - para establecer las líneas de niveles
- Line_Width - para establecer las líneas de nivel
- Price_Width - para fijar la etiqueta del precio


El usuario no ha dejado ningún comentario para su valoración