Fibonacci Calculator
- Indicadores
- Versión: 3.0
- Activaciones: 5

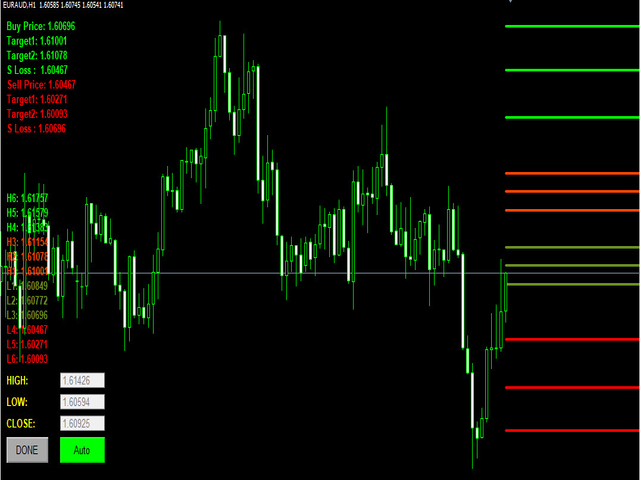
El uso de la calculadora de Fibonacci con las Ondas de Elliot puede generar resultados notables. Un trader puede utilizar estos niveles o ratios para encontrar operaciones de alta probabilidad con un stop loss muy pequeño. También puede utilizar estos ratios para encontrar extensiones de Ondas de Elliot y reservar beneficios cerca de esos niveles. Para los expertos en Ondas de Elliot, la calculadora de Fibonacci es una herramienta muy útil que puede ayudarles a calcular los niveles de extensión y retroceso de Fibonacci para el precio de mercado.
El indicador demuestra ser útil, ya que se puede dibujar entre dos puntos de precio significativos, como un máximo y un mínimo, y luego el indicador va a crear los niveles entre esos dos puntos.
Indicador de trabajo con automático Alto, Bajo y Cerrar , también podemos proporcionar entrada personalizada Alto, Bajo y Cerrar