Market Pressure
- Indicadores
-
Chantal Sala
 Hi, I'm a programmer (female) from 1995 and in MQL4 from 2008.
I have released most of 2500 Expert Advisor/Indicators and Dashboard.
I have worked with many famous italian traders to automate their strategy. - Versión: 1.1
- Actualizado: 30 agosto 2022
- Activaciones: 10
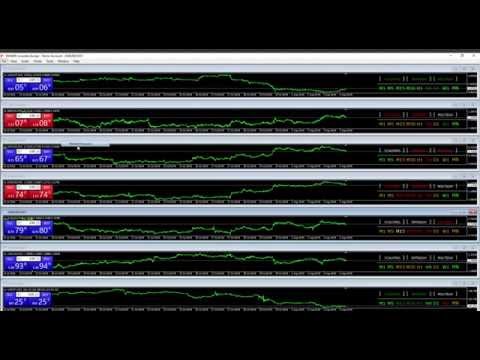
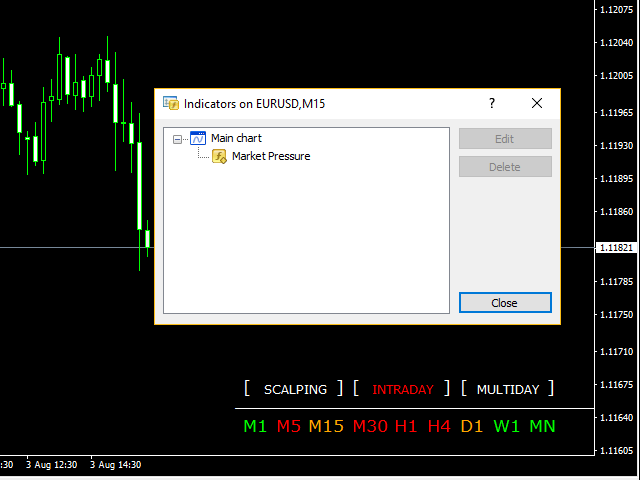
Market Pressure es una pantalla de última generación.
Su sistema de gráficos sencillo e intuitivo le permite recibir las indicaciones muy fácil y rápidamente.
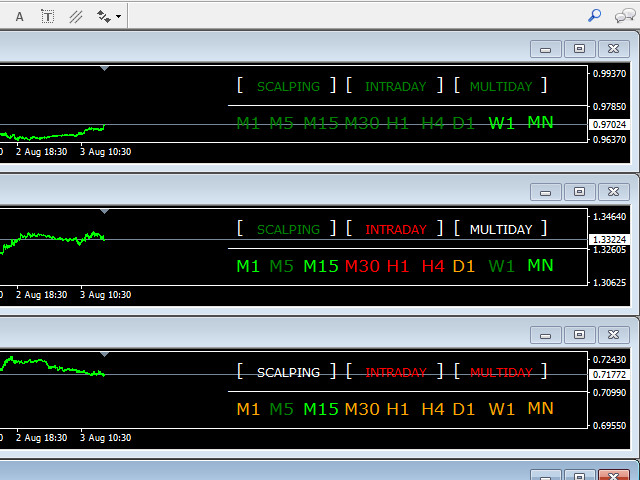
Este indicador puede dar tres métodos diferentes de señales: Scalping, Intradía y Multidía.
La lógica se basa en la acción del precio que se combina en múltiples marcos de tiempo. Puede dar señales de muy alta calidad.
Una herramienta indispensable para aquellos que quieren entender la presión del mercado y la tendencia operativa.
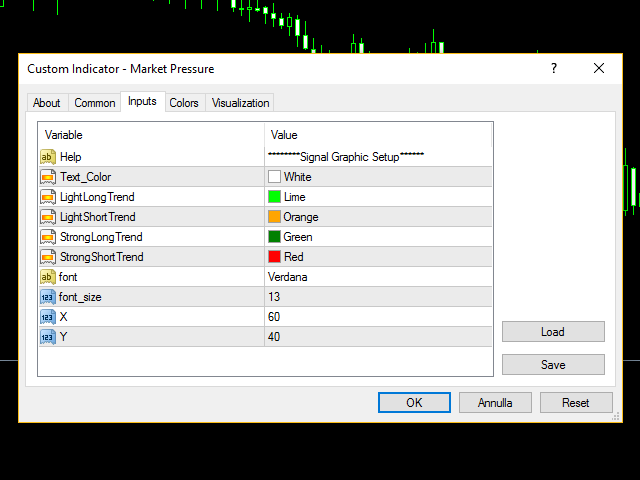
El indicador es personalizable tanto para los colores para el tamaño de fuente, todavía recomendamos no cambiar nuestros parámetros como optimizado para devolver excelente resultado gráfico.
Valores de entrada
Configuración del gráfico de señales
- Text_Color (paréntesis y color de la fila)
- LightLongTrend (señal débil LONG en TF)
- LightShortTrend (señal SHORT débil en TF)
- StrongLongTrend (fuerte señal LONG en TF)
- StrongShortTrend (fuerte señal SHORT en TF)
- font = "Verdana" (modificable)
- font_size (modificable)
- X (posición del panel)
- Y (posición del panel)