Volume Spyke
- Indicadores
-
Chantal Sala
 Hi, I'm a programmer (female) from 1995 and in MQL4 from 2008.
I have released most of 2500 Expert Advisor/Indicators and Dashboard.
I have worked with many famous italian traders to automate their strategy. - Versión: 3.0
- Actualizado: 20 diciembre 2021
- Activaciones: 10
El indicador Volume Spike es una herramienta útil para identificar la intención direccional del mercado.
Cómo Funciona:
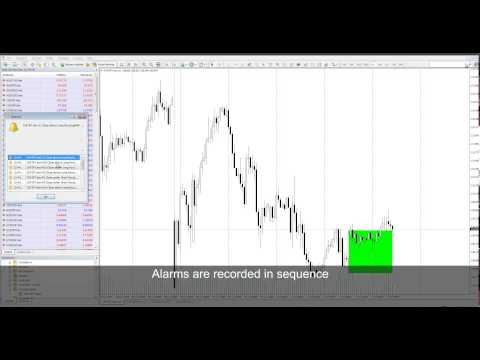
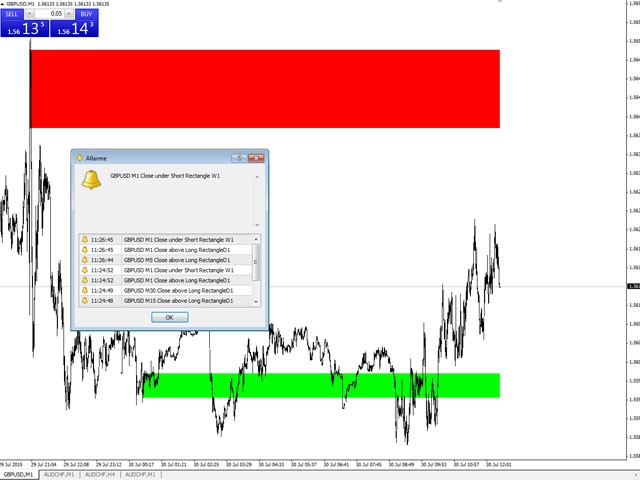
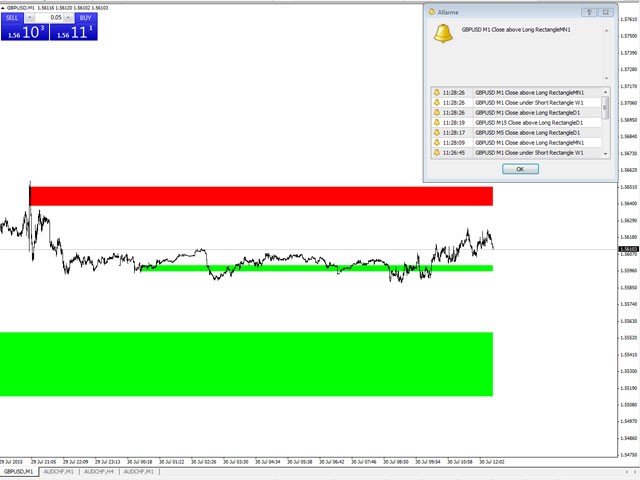
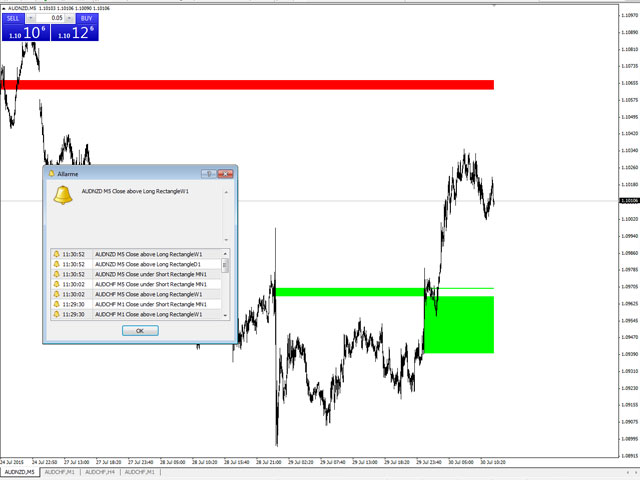
El indicador Volume Spike identifica los picos de volumen y crea un rectángulo sensible equipado con Alerta y Advertencia Pop Up que sugiere la dirección del mercado.
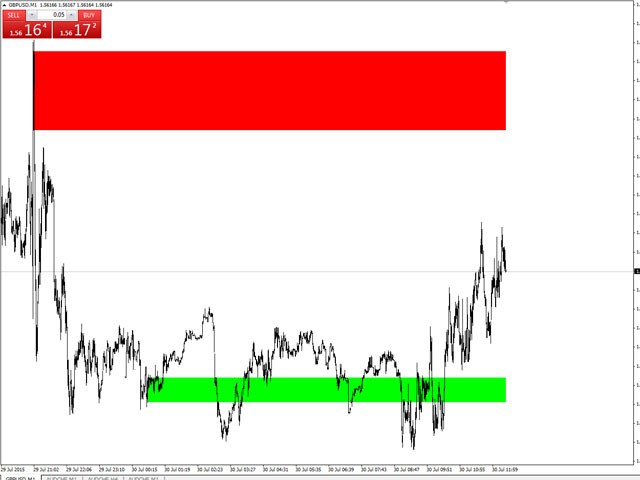
Esta herramienta tiene la capacidad de seleccionar el marco de tiempo en el cual hacer el análisis de volumen y da una gran señal visual coloreada en rectángulo.
El indicador puede identificar señales válidas del mercado, pero también puede sugerir excelentes puntos de soporte y resistencia.
Por favor, vea el video para tener una idea general de cómo funciona.
Parámetros de entrada:
- TimeFrame Período en el que el indicador realizará el análisis
- Configuración gráfica del rectángulo (como color, estilos de línea, anchura...)
- Configuración de Sonido y Popup (ON/OFF, wav)
Importante:
Puede elegir otro wav para el Sonido (Guarde su sonido en el directorio MT4 Sounds) y escríbalo en el parámetro Sound


good indicators