Buy and Sell Moments
- Indicadores
- Versión: 1.15
- Activaciones: 5

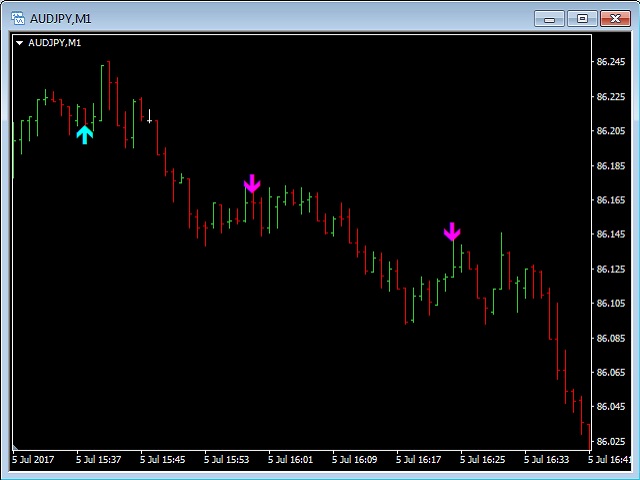
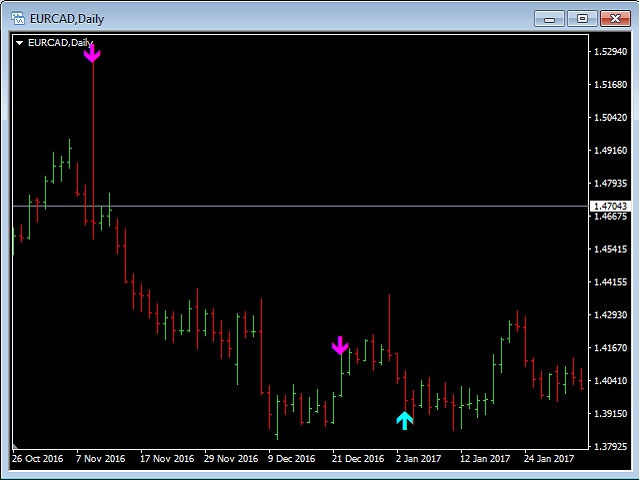
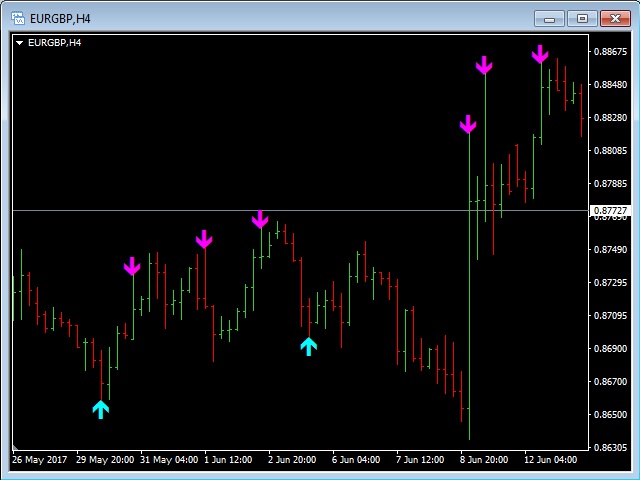
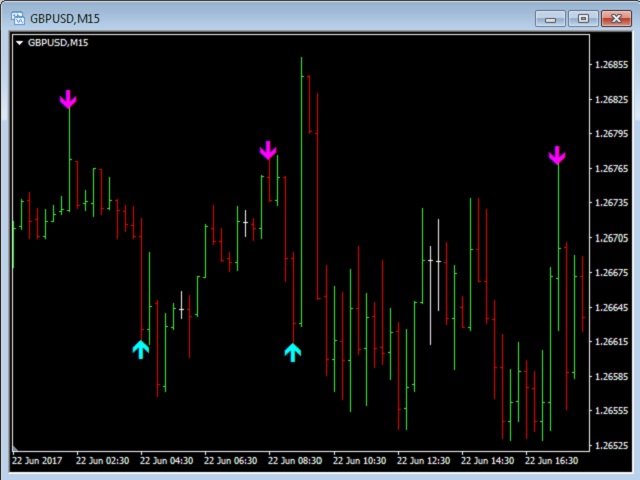
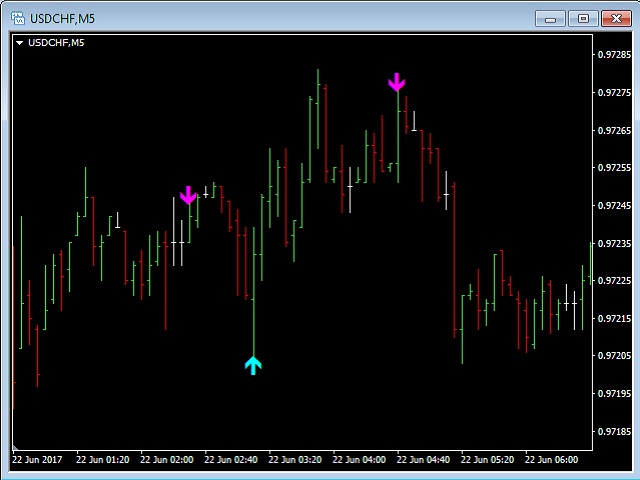
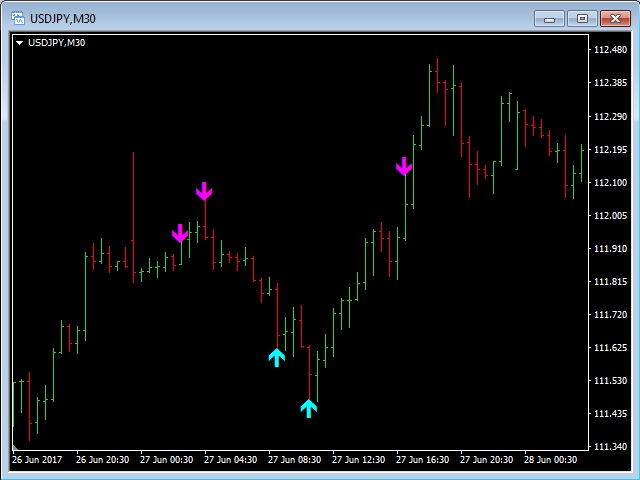
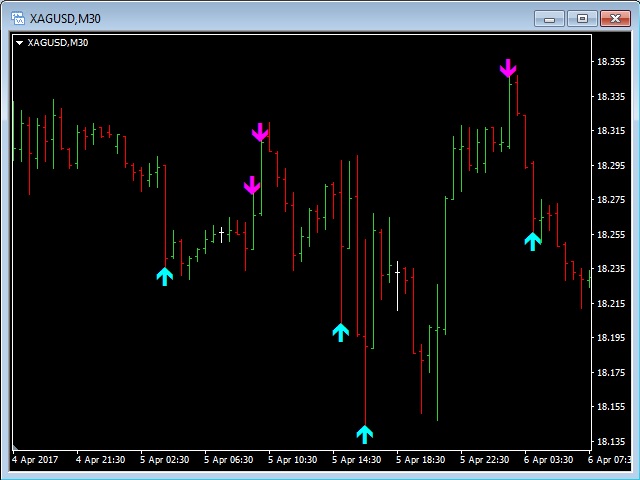
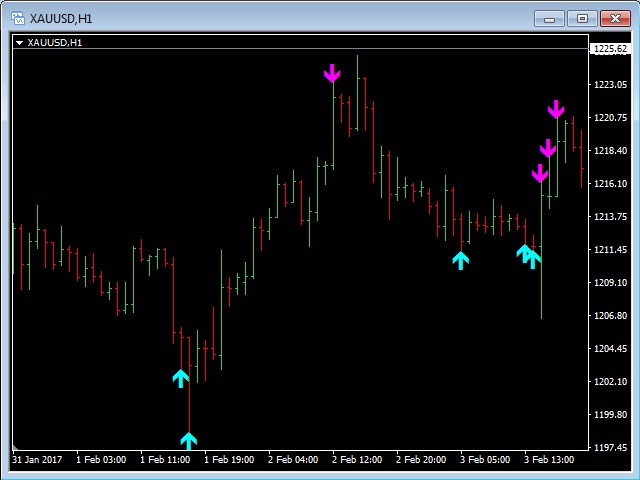
Este indicador mostrará la flecha de Compra (color Aqua) o Venta (color Magenta) en el momento en que se espera una tendencia local Larga o Corta (local al TimeFrame actual).
La gran ventaja es que el indicador no tiene ningún parámetro de entrada. Por lo tanto, usted no perderá su tiempo y no luchará para cambiarlos para diferentes TimeFrames y pares de divisas. Este indicador es universal, pero funcionará mejor en H1 y TFs inferiores.