Multiple Time Frame Commodity Channel Index
- Indicadores
- Versión: 3.15
- Activaciones: 5

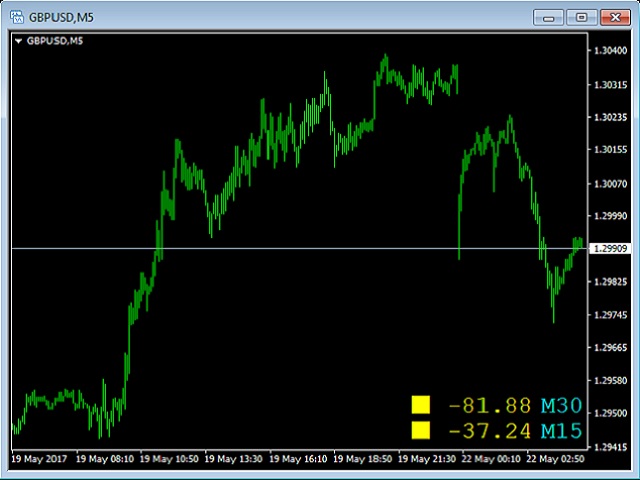
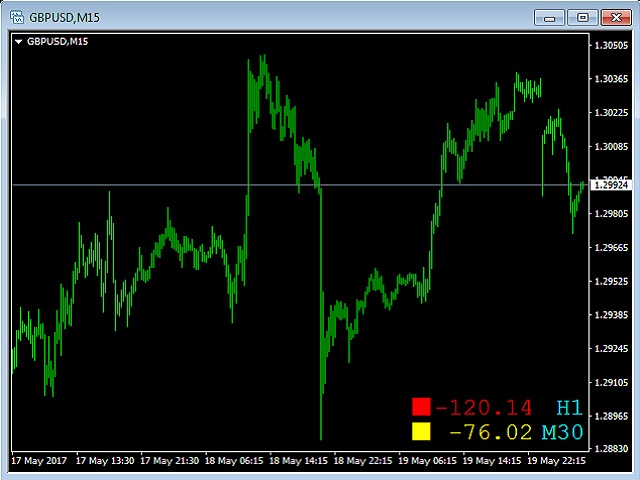
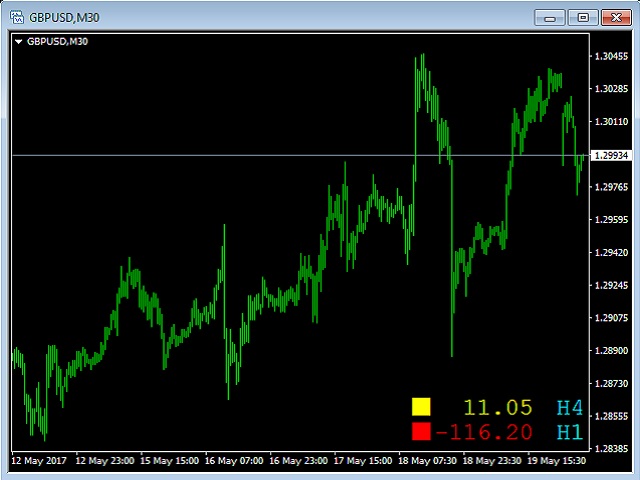
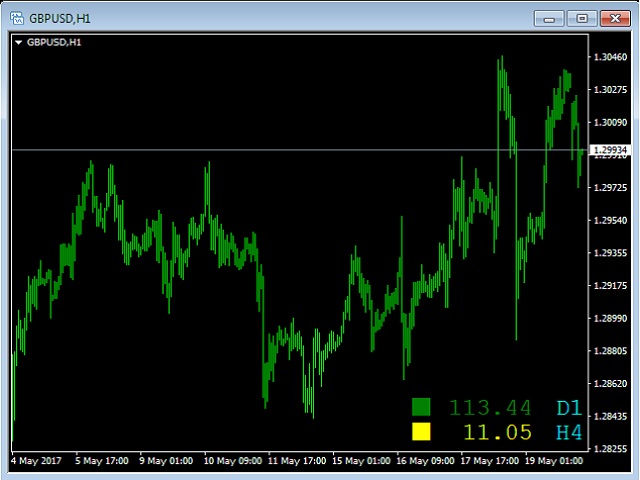
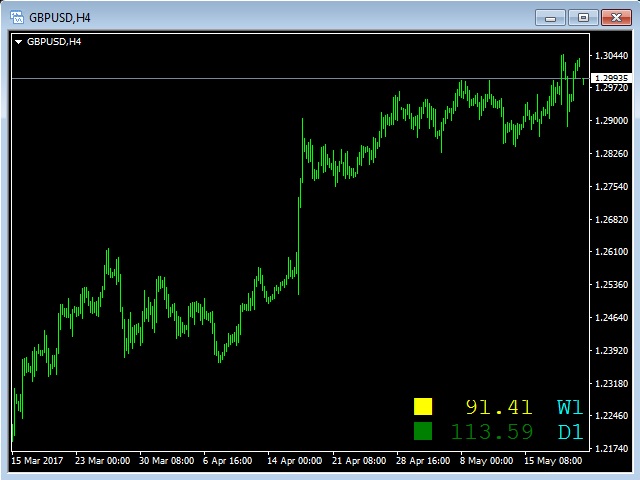
Este indicador se basa en un indicador clásico de Commodity Channel Index (CCI) y muestra valores digitales de CCI de dos marcos temporales superiores (al actual). Si, por ejemplo, lo pone en el M1 TF mostrará los valores digitales del CCI desde M5 (TF1) y M15 (TF2).
Como todo el mundo sabe, el CCI utiliza los límites +100 (LevelUp) y -100 (LevelDn). Usted tiene la posibilidad de cambiar esos números de acuerdo a su estrategia.
Cuando un gráfico de línea del CCI va a ir más alto que LevelUp entonces un cuadrado verde aparecerá cerca de un número digital que representa el indicador CCI.
Cuando un gráfico lineal del CCI sea inferior a LevelDn, aparecerá un cuadrado rojo cerca de un número digital que representa el indicador CCI.
Un cuadrado amarillo representa un gráfico lineal entre límites.
Parámetros de entrada
- Period1 - Periodo del CCI para TF1.
- appPrice1 - Precio aplicado del CCI para TF1.
- Period2 - Periodo del CCI para TF2.
- appPrice2 - Precio CCI aplicado para TF2.
- LevelUp - Límite superior del CCI.
- LevelDn - Límite inferior del CCI.
- corner - Esquina del gráfico a la que se adjunta un mensaje de texto.
Este indicador se puede utilizar en M1, M5, M15, M30, H1, H4 y D1 TFs.