Tipu Heikin Ashi Panel
- Indicadores
-
Kaleem Haider
 Please note that I do not do Freelance orders anymore. Please report anyone posing as me as Freelancer
 - Versión: 2.10
- Actualizado: 5 febrero 2018
Tipu Heikin-Ashi Panel es la versión modificada del indicador original Heiken Ashi publicado por MetaQuotes aquí.
Una versión profesional de este indicador está disponible aquí.
Características
- Un Panel fácil de usar que muestra la tendencia Heiken Ashi del marco de tiempo seleccionado.
- Alertas personalizables de Compra/Venta, alertas push, alertas por email, o alertas visuales en pantalla.
- Panel Personalizable. El panel puede moverse a cualquier lugar del gráfico o minimizarse para disponer de más espacio.
Heikin significa "la media", y Ashi significa "pie" en japonés. Heikin-Ashi es la técnica de gráficos japonesa que utiliza promedios de precios para trazar las velas. Esta técnica suaviza algo el ruido en los gráficos de velas en un esfuerzo por ofrecer una mejor imagen de la tendencia. Otro ejemplo de indicador de suavizado común son las medias móviles, que pueden utilizarse junto con Heikin-Ashi.
Cómo utilizarlo
Las velas azules significan tendencia alcista, y las rojas tendencia bajista. Por ejemplo, si un periodo pertinente es alcista, el panel mostrará color azul para ese periodo. También mostrará una señal visual de "compra" después de un cambio de vela de rojo a azul. Como mejor práctica, se recomienda considerar las señales de otros marcos temporales y/u otros indicadores antes de tomar una decisión comercial.
Cálculo
Cierre = (Apertura+Alta+Baja+Cierre)/
Apertura = [Apertura (barra anterior) + Cierre (barra anterior)]/2
Alto = Max (Alto,Apertura,Cierre)
Mínimo = Mínimo (Mínimo, Apertura, Cierre)
Parámetros
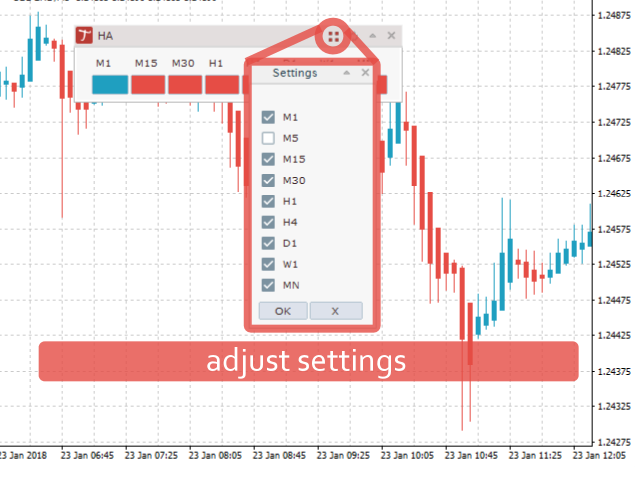
- Mostrar Panel - ajustes de visibilidad, seleccione verdadero/falso para mostrar el panel
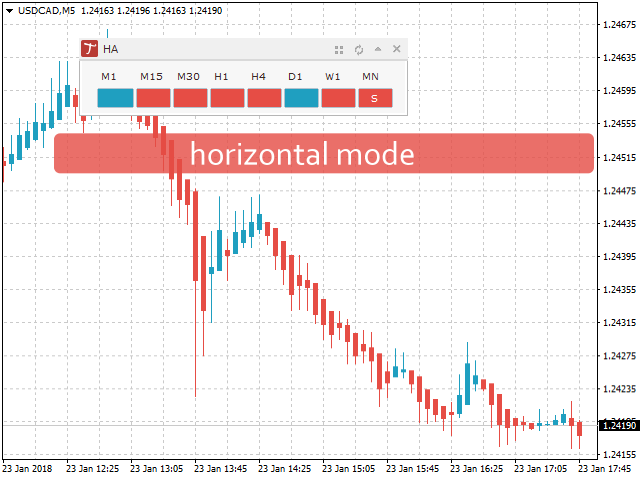
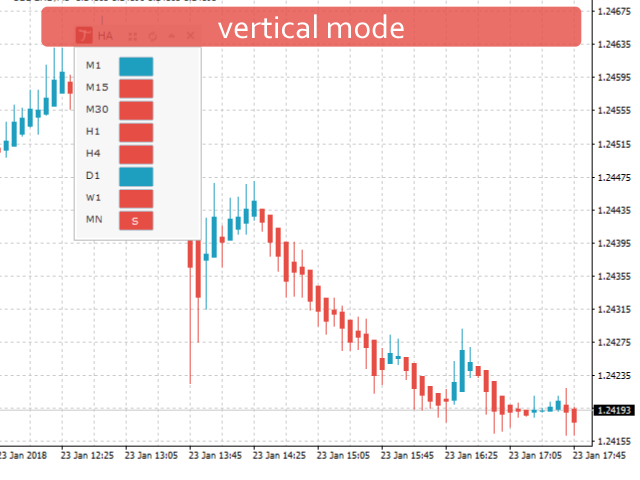
- Modo de Diálogo - Vertical/Horizontal - por ejemplo, horizontal pone los marcos de tiempo horizontales.
- Indicador superpuesto - Elija esta opción si desea que Heikin Ashi aparezca sobre su gráfico de velas, gráfico de barras o gráfico de líneas.
- Uptrend Color - ajustes para el color de la tendencia alcista en el panel, para cambiar el color de la vela de tendencia alcista elija los ajustes de color además de los ajustes de entrada.
- Color de Señal de Compra - color de señal de compra en el panel, esto mostrará compra/venta en el cambio del color de la vela.
- Color de la tendencia bajista: configuración del color de la tendencia bajista en el panel.
- Color de la señal de venta- color de la señal de venta en el panel
- Desplazamiento de Alerta - retardo de vela para la señal, introduzca 1 si desea que la alerta se envíe después de que pase 1 vela
- AlertaMóvil - seleccione verdadero/falso para recibir notificaciones push en su dispositivo, asegúrese de que la configuración del dispositivo es correcta aquí
- Alertaen Pantalla - seleccione verdadero/falso para recibir la alerta en el terminal, esta alerta se muestra en una ventana separada.
- Alertapor correo electrónico - seleccione true/false para recibir alertas por correo electrónico, asegúrese de que la configuración del correo electrónico es correcta aquí
Desarrollador
int shift = 1; //utiliza esto para mirar hacia atrás, 0 significa la vela más actual, 1 significa la vela anterior

int iSignal = iCustom(_Symbol,_Period,"Market/Tipu Heikin Ashi Panel","",false,0,false,false,false,false,false,false,false,false,false,clrNONE,clrNONE,clrNONE,clrNONE,"",1,false,false,false,4,shift);

int iTrend = iCustom(_Symbol,_Period,"Market/Tipu Heikin Ashi Panel","",false,0,false,false,false,false,false,false,false,false,false,clrNONE,clrNONE,clrNONE,clrNONE,"",1,false,false,false,5,shift); //

if (iSignal == OP_BUY) //representados por "B" y "S" que aparecen en el panel,
if (iTrend == OP_BUY) //representados por recuadros de color azul


Very nice tool