Market Marker MT4
- インディケータ
- バージョン: 3.7
- アップデート済み: 5 11月 2023
- アクティベーション: 10

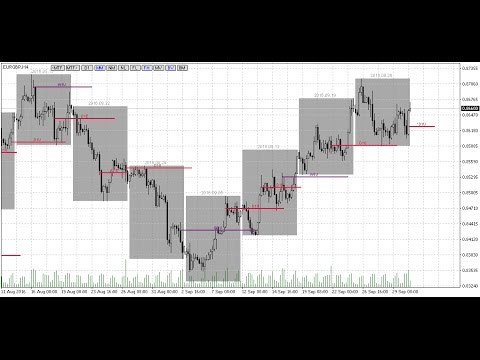
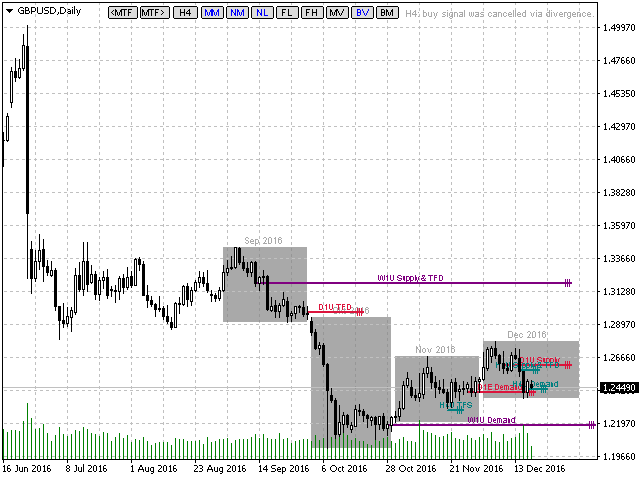
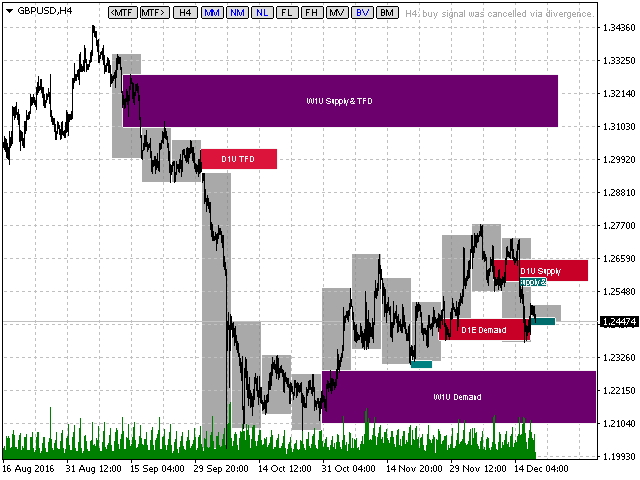
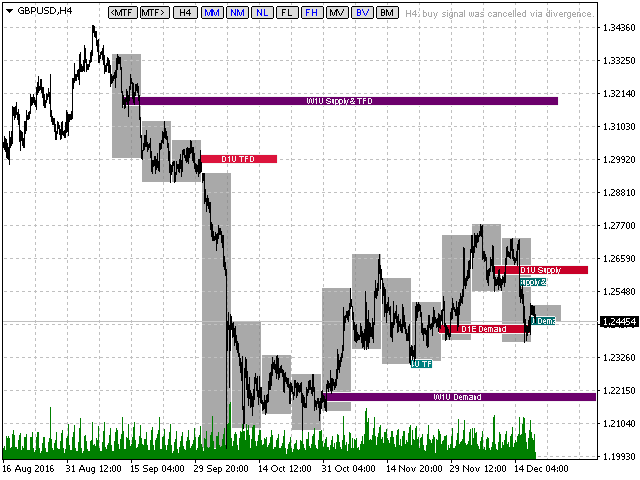
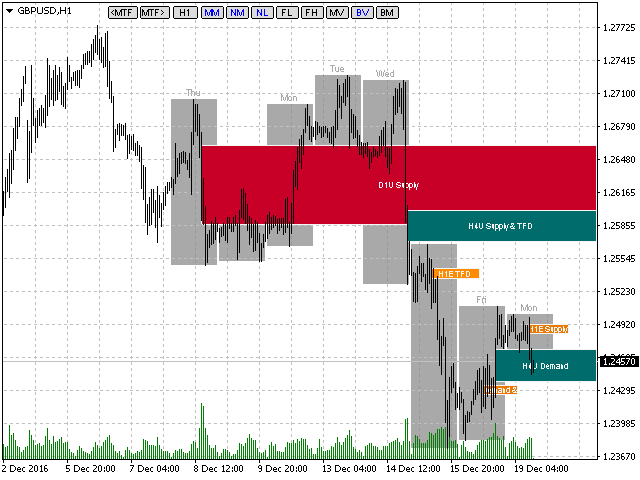
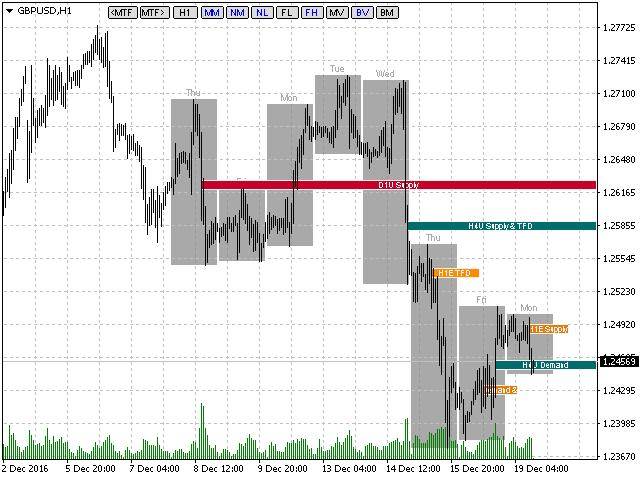
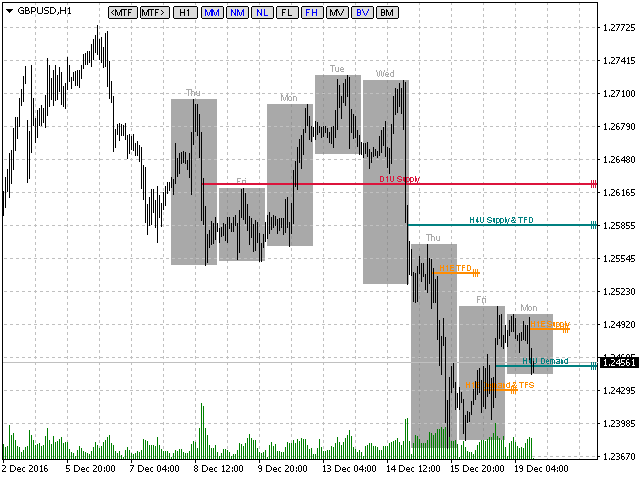
The indicator displays peak levels of activity formed by the maximum volume, tracks the correlation of the candles on all timeframes (from the highest to the lowest one). Each volume level is a kind of key trading activity. The most important cluster is inside a month, week, day, hour, etc.
Indicator operation features
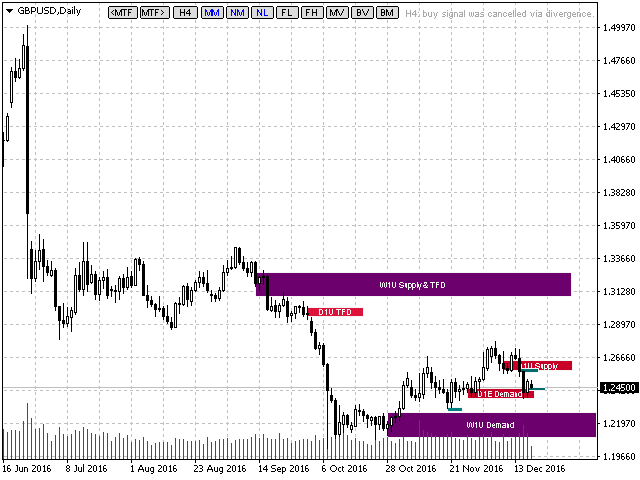
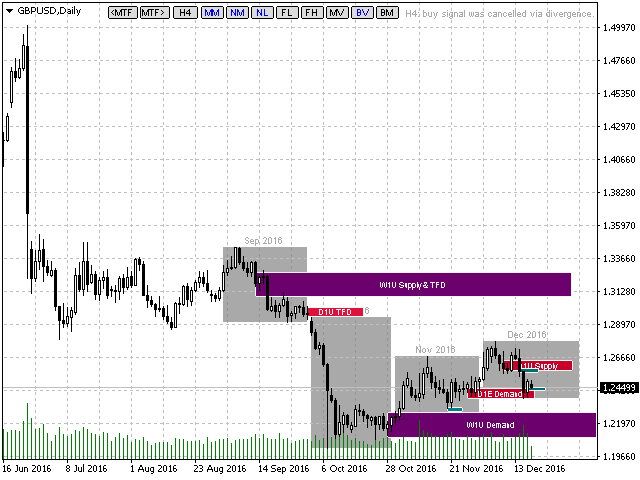
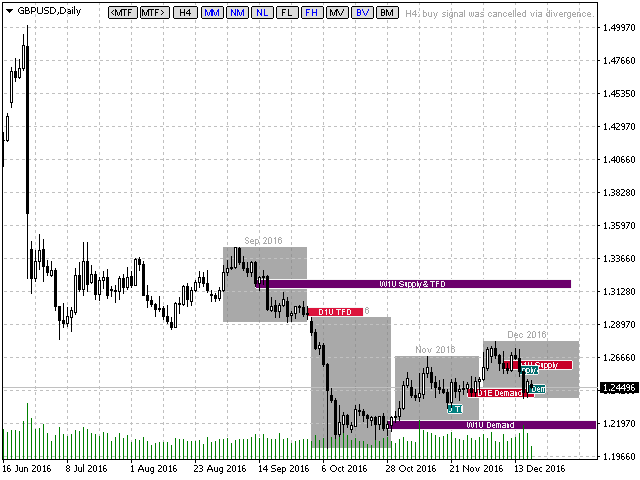
A volume level receives Demand status if the nearest volume level located to the left and above has been broken upwards. A volume level receives Supply status if the nearest volume level located to the left and below has been broken downwards.
Apart from supply and demand levels, the indicator finds target levels – TFD (Target For Demand) and TFS (Target For Supply). A target level for a demand one is the nearest level located to the left and above and not broken upwards. A target level for a supply one is the nearest level located to the left and below and not broken downwards.
Indicator buttons
- MTF (MarkersTimeFrame) – select the period, starting from which volume levels are displayed.
- MM (MarkersMode) – enable/disable level display mode.
- NM (NearestMarkers) – display only several levels nearest by time that are above and below the current open price. The number of displayed levels is set by MarkersLastNearest input parameter.
- NL (NormalizationLength) – length of levels is proportional to the candle volumes of the timeframe they belong to. As a result, levels from higher timeframes become longer allowing you to see them more clearly. In normal mode, the length of levels is proportional to the candle volumes of the current timeframe.
- FL (FixLength) – use the fixed length of levels set in monitor pixels (the length itself is set by MarkersFixLength input parameter).
- FH (FixHeight) – use the fixed height of levels set in monitor pixels (the height itself is set by MarkersFixHeight input parameter).
- MV (MarkersView) - representation of levels: thick of thin lines.
- BV (BordersVisible) - enable/disable period frames.
- BM (BoxMode) – enable/disable bars coloring mode.
Inputs
- Alerts - enables/disables additional showing of trading tips in the alert window.
- Advices - enables/disables trading tips.
- VolumeIncreaseCheck - cancel the signal if the volume increases as the price approaches the level.
- BackwardBalanceCheck - cancel the signal if the total summary balance is reversed when the price leaves the level and returns to it.
- ShowPreliminaryMarkers - show/hide the preliminary levels.
- VolumesType - type of volumes: tick or real if provided by the broker.
- ButtonsPosition - arrangement of buttons.
- MarkersArea - width of the levels based on the timeframe, measured in ATR.
- MarkersLastNearest – the number of the nearest levels displayed in NM mode.
- BoxContrast – visualizing parameter for BM mode, default – 1.0, fractional step. If the chart has too many purple and red bars, decrease the variable value below 1.0. If the chart has too many gray and yellow bars with almost no red and purple ones, set the variable value higher than 1.0. This parameter is set only once.
- FutureSymbol – if you trade a currency pair or a futures, leave the field completely blank. If you trade index, and your broker provides quotes also for the futures on the index, then enter the name of the instrument indicating that futures in this field, for example, #S&P500_M6. Thus, the indicator will work on the index, but the data on the volume will be taken from futures.
The remaining inputs refer to other settings (line color, width or length font size, etc.), and their purpose is clear from their names.


Хороший индикатор.