AnyProfile MT5
- Indicateurs
-
Evgeny Shevtsov
 Indicators for volume trading :
Volume profile,
Classic profile,
Clusters chart,
Demand and supply levels,
Demand and supply diagram,
Cumulative delta.
Indicators for probabilistic analysis :
Monte Carlo predictor,
Neural predictor. - Version: 4.6
- Mise à jour: 30 avril 2026
- Activations: 10
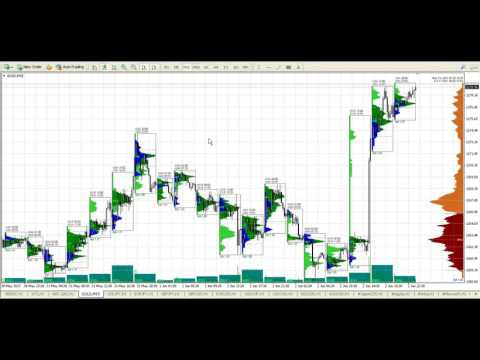
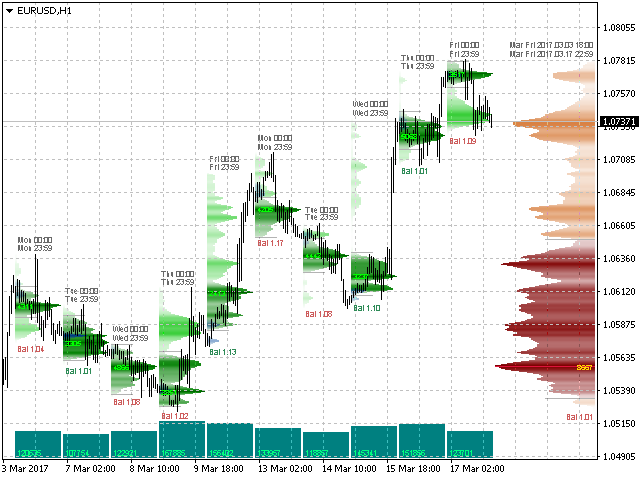
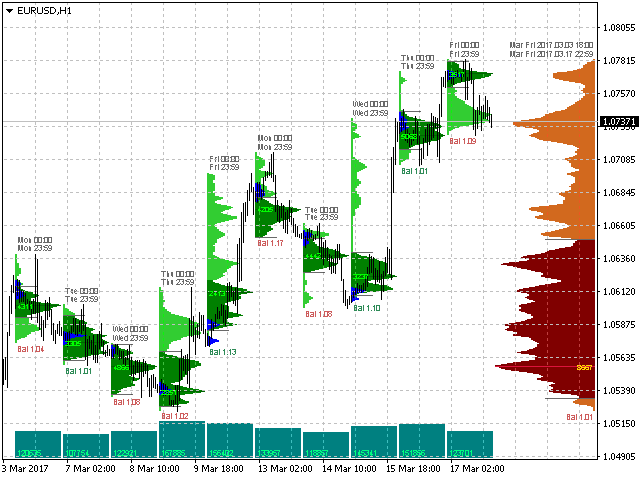
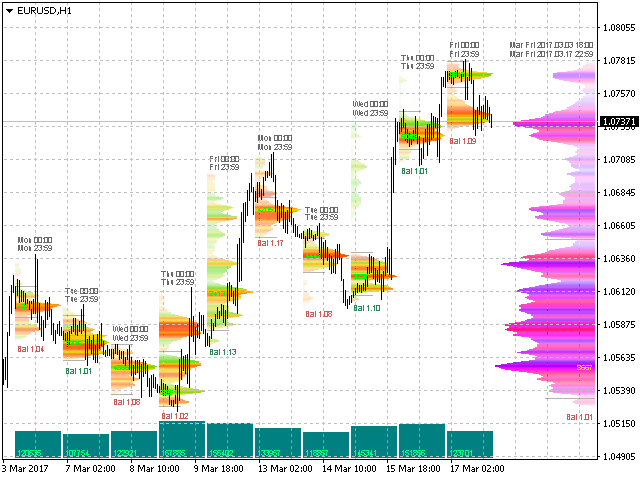
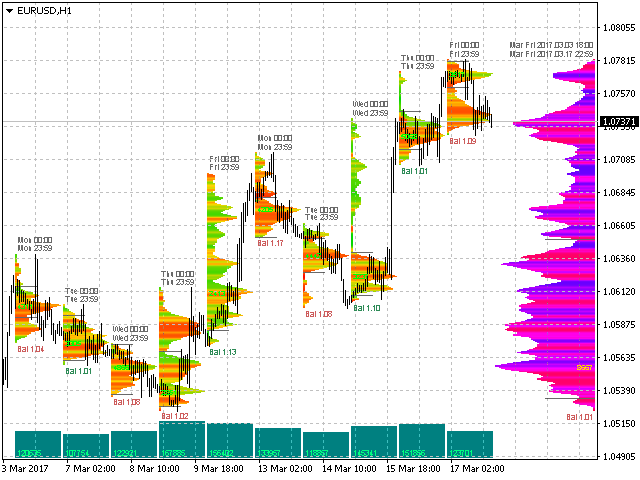
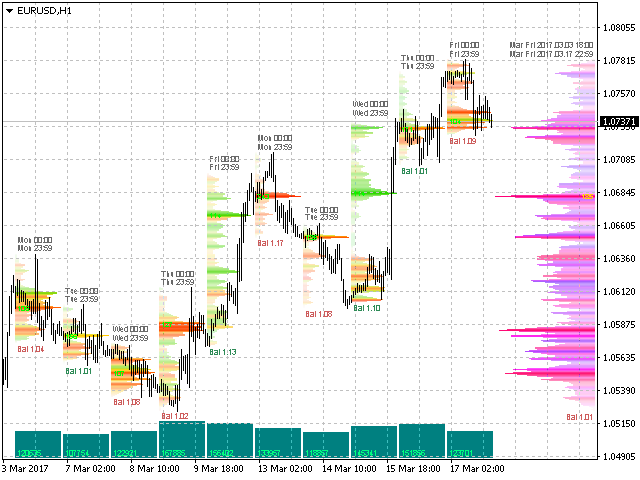
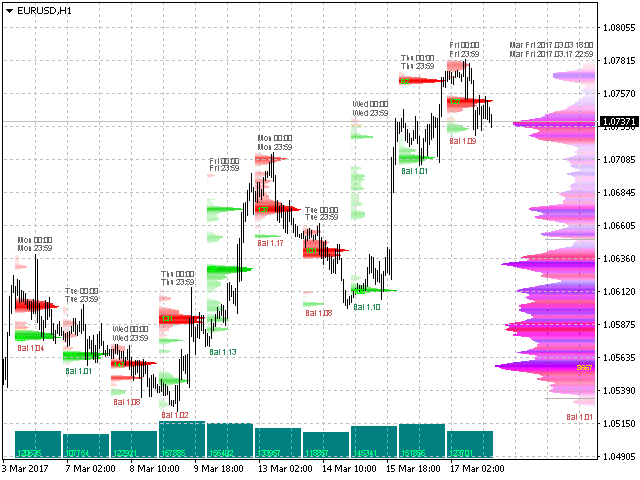
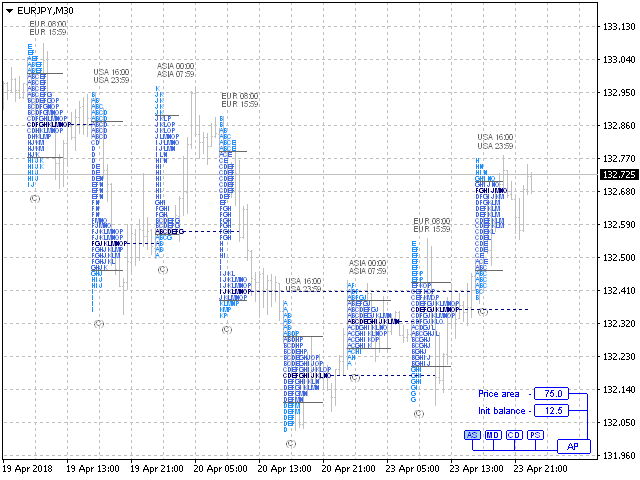
The indicator displays market profiles of any duration in any place on the chart.
Simply create a rectangle on the chart and this rectangle will be automatically filled by the profile. Change the size of the rectangle or move it - the profile will automatically follow the changes.
Operation features
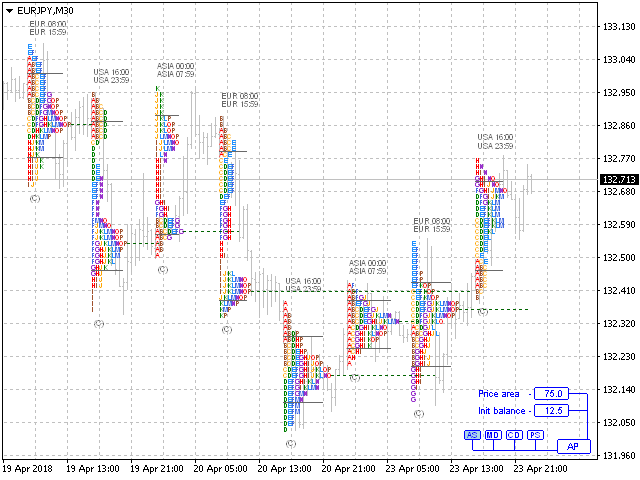
The indicator is controlled directly from the chart window using the panel of buttons and fields for entering parameters.
In the lower right corner of the chart window there is a pop-up "AP" button of the main menu, which is conditionally divided into two halves - clicking on the left half switches groups of control buttons, clicking on the right half switches groups of fields for entering parameters.
The indicator properties window contains, basically, only input variables related to the settings of colors, fonts size, line thickness, and so on.
The indicator remembers the settings (button status and numeric field values) individually for each timeframe.
The description of the indicator controls is on the "Comments" tab in post 293 of 21/11/2021.


Hello Traders, if you are looking for an indicator that will help you find sniper entries, then look no further. AnyProfile (Volume Profile, and so much more!) will help you follow big institutions as they are not able to hide their footprints. Volume is often overlooked or underused, but it is the only true indication of where big institutions are building their positions. Candle patterns, trendlines, S&R, S&D, inducement, etc. are created by big institutions to take your money (mostly algos, which is why they are often so precise), but they can't manipulate volume and you can bet they will defend their positions. AnyProfile can assist you in trading with the big institutions and not against them. I never place a trade without consulting it first. You will find that this is the only indicator that you will want on your charts. Go get it!