Interceptor PRO Volume Extremes Indicator
- Indicadores
-
Dominik Mandok
 Forex, Commodities, Equities and Indices Trader, Programmer and Developer @ theinvestbay.com
 - Versión: 2.1
- Actualizado: 30 noviembre 2021
- Activaciones: 10
Interceptor - indicador profesional de volumen y precios extremos.
Interceptor es un potente indicador, que gracias a una combinación de cuatro tipos diferentes de indicadores normalizados en un algoritmo puede identificar correctamente los extremos del precio que conducen a retrocesos e inversiones en la tendencia. El algoritmo se basa principalmente en la combinación de Acumulación/Distribución, Volumen en Balance, Índice de Flujo de Dinero e Índice de Fuerza Relativa.
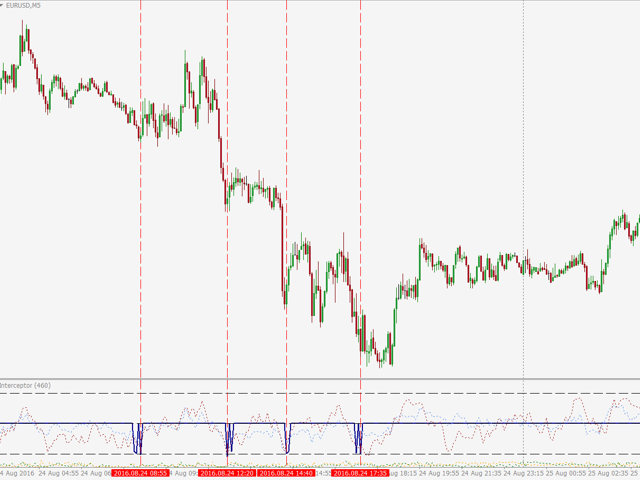
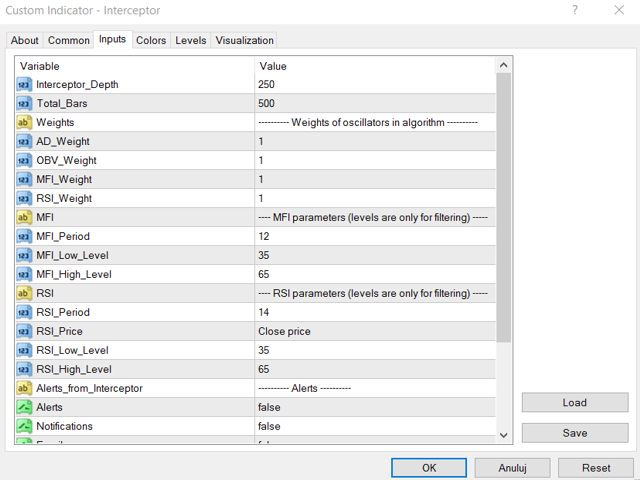
El primer parámetro de Interceptor es Interceptor_Depth que define el rango de normalización en el número de barras tomadas para el análisis de Acumulación/Distribución y Volumen en Balance. Sugiero probar muchos valores diferentes de Interceptor_Depth y puedo recomendar, entre otros, probar 75, 150, 250 y 460. Por favor, recuerde, cuanto menor sea el parámetro (rango de normalización), más rápida será la reacción del indicador en el movimiento del volumen y el precio.
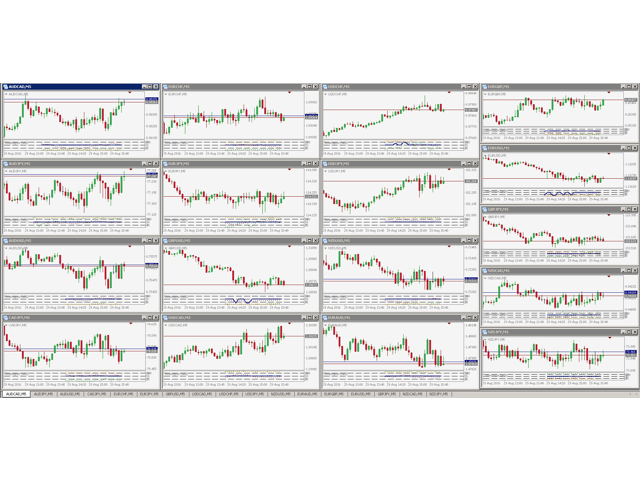
El segundo parámetro, Total_Bars, determina el número de barras visibles en la ventana del indicador. Menos barras - menos recursos necesarios para generar la línea del indicador (trabajo más rápido, especialmente con muchos pares, por ejemplo en VPS - se puede ver esta situación en una de las capturas de pantalla a continuación).
Los siguientes cuatro parámetros determinan los pesos de A/D, OBV, MFI y RSI. Puede ajustar con precisión la precisión de Interceptor para cada par de divisas, acciones, materias primas, etc. y para diferentes marcos de tiempo utilizando el peso de cada componente del algoritmo y ajustando los niveles. Podemos desactivar completamente un componente específico del algoritmo estableciendo el parámetro peso a 0. Por ejemplo, si queremos analizar sólo los cambios en el volumen, debemos establecer RSI_Weight a 0.
Los siguientes dos bloques de parámetros contienen ajustes para el Índice de Flujo Monetario y el Índice de Fuerza Relativa. En ambos casos, sólo el período(MFI_Period y RSI_Period) tiene un impacto en el algoritmo del Interceptor. Todos los niveles(MFI_Low_Level, MFI_High_Level, RSI_Low_Level y RSI_High_Level) determinan la apariencia final de la línea de Interceptor filtrando los valores divergentes de RSI y MFI y estableciendo la línea de Interceptor en el nivel neutral = 50. Por ejemplo, si establece MFI_Low_Level=20, MFI_High_Level=80, RSI_Low_Level=30 y RSI_High_Level=70, la línea de Interceptor estará por encima de 50 sólo si el valor de MFI estará por encima de 80 y el valor de RSI estará por encima de 70. La línea del Interceptor estará por debajo de 50 sólo si el valor de MFI es inferior a 20 y el valor de RSI es inferior a 30. Para desactivar completamente el filtrado con niveles, debe establecer MFI_Low_Level a 100, MFI_High_Level a 0, RSI_Low_Level a 100 y RSI_High_Level a 0. Pero recomiendo utilizar al menos niveles iguales a 30/70 o 40/60 para ver sólo señales significativas. Por cierto, para el RSI también se puede establecer el tipo de precio aplicado - por defecto es el precio de cierre.
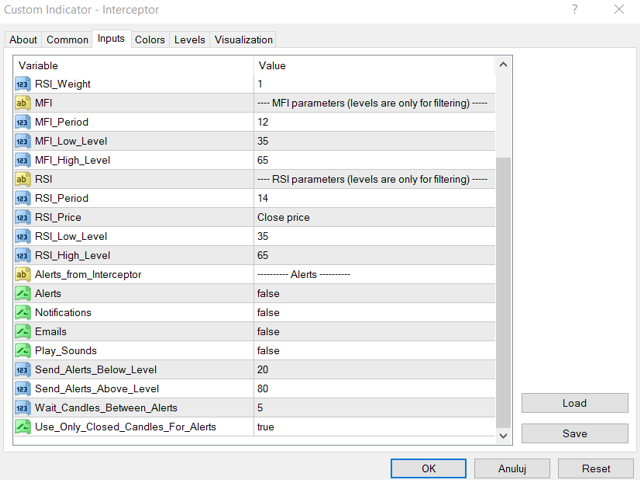
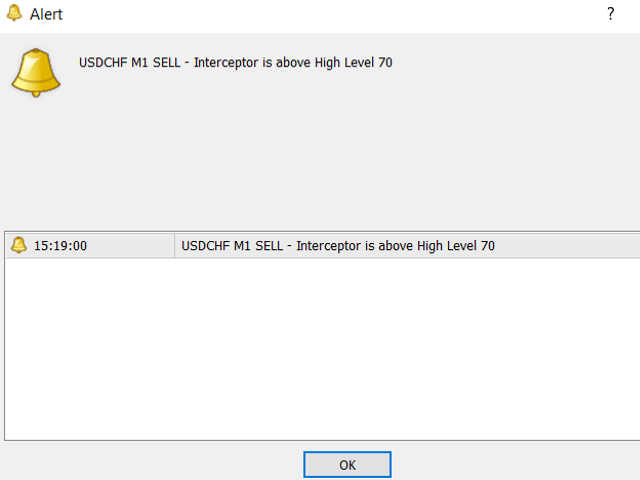
El último bloque con parámetros contiene los ajustes para las alertas. Puede utilizar cuatro tipos diferentes de alertas: notificaciones de alerta a través de la terminal MetaTrader (como se puede ver en una captura de pantalla con un ejemplo), notificaciones push a dispositivos móviles (smartphone, tablet), mensajes de correo electrónico (por ejemplo, desde un VPS) y alertas sonoras en MT4. Puede establecer un nivel bajo y alto para las alertas(Send_Alerts_Below_Level y Send_Alerts_Above_Level) y el periodo de retraso entre las siguientes alertas(Wait_Candles_Between_Alerts). El último parámetro Use_Only_Closed_Candles_For_Alerts determina si quieres recibir alertas inmediatamente cuando el valor del Interceptor excede el Nivel Bajo o Alto(Send_Alerts_Below_Level y Send_Alerts_Above_Level) cuando está en False o quieres tener una confirmación y recibir alertas sólo cuando el valor del Interceptor excede uno de estos niveles para una vela cerrada.
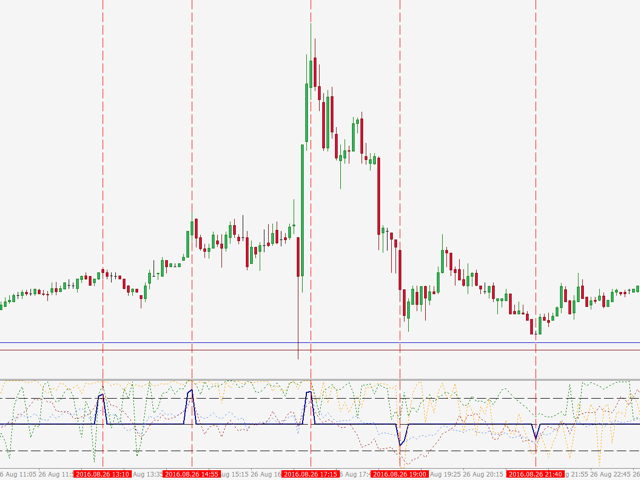
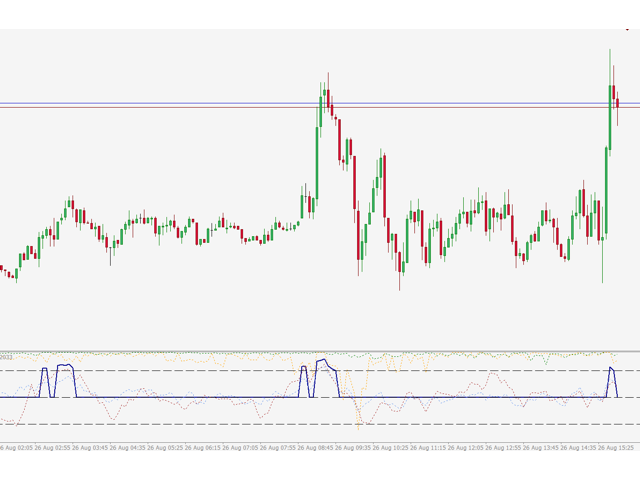
Para los parámetros por defecto, le sugiero que COMPRE sólo si la línea Interceptor está por debajo de 20 o 15 y VENDER sólo si la línea Interceptor está por encima de 80 u 85. Estos niveles dependen de la configuración de todos los componentes del sistema en el par de divisas especificado y el marco de tiempo, pero sugiero empezar a cambiar los parámetros de la configuración por defecto, ya que son más versátiles y adecuados para todos los pares.
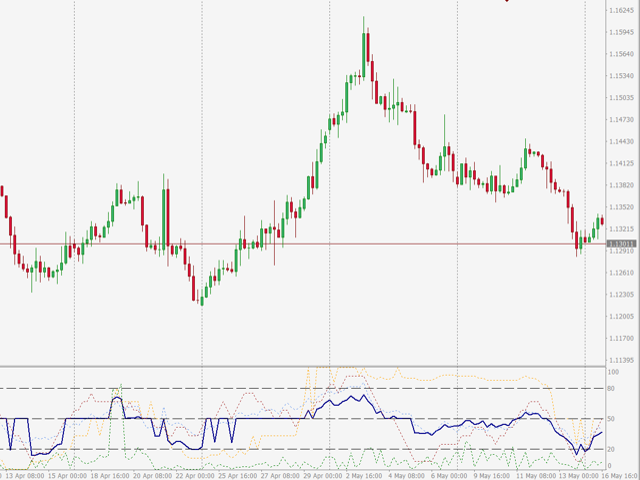
Por defecto, después de conectar el indicador al gráfico, verá en la nueva ventana del indicador una línea sólida Interceptor(azul oscuro) y otras cuatro líneas de puntos: la línea normalizada de Acumulación / Distribución(verde), la línea normalizada de Volumen en Balance(naranja), la línea del Índice de Fuerza Relativa(azul aciano) y la línea del Índice de Flujo de Dinero(marrón). Todos los colores son editables. Si desea eliminar todas las líneas de la ventana excepto la línea Interceptor, debe establecer todos los colores excepto la línea Interceptor (Azul oscuro) en Ninguno.
Al final, me gustaría darle un consejo. Para crear una estrategia comercial basada en este indicador, le sugiero que espere la confirmación con la siguiente vela después de la alerta. Antes de abrir una nueva orden, debe ocurrir Engulfing Pattern o Doji (o algo similar) y luego se mueven significativamente en la dirección opuesta. Si desea más consejos en esta área, por favor escríbame.
Recuerde, nadie excepto usted mismo es responsable de cualquier decisión de inversión tomada por usted.
Le deseo buena suerte.


Great indicator. the best of many that I have purchased.