Volume weighted RSI Pointer MFI
- Indicadores
-
Dominik Mandok
 Forex, Commodities, Equities and Indices Trader, Programmer and Developer @ theinvestbay.com
 - Versión: 1.1
- Actualizado: 30 noviembre 2021
- Activaciones: 10
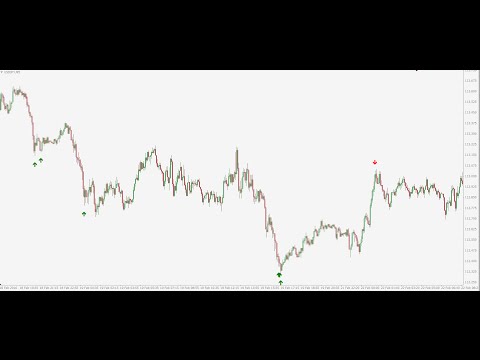
MFI Pointer es un indicador basado en el indicador Money Flow Index que utiliza tanto el precio como el volumen para medir la presión de compra y venta. Money Flow Index también se conoce como RSI ponderado por volumen.
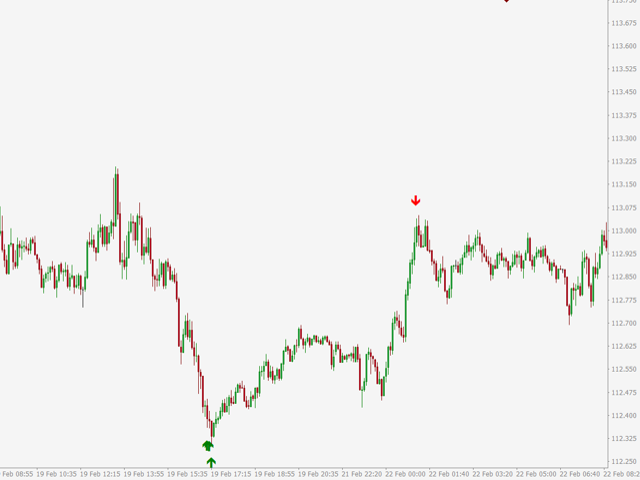
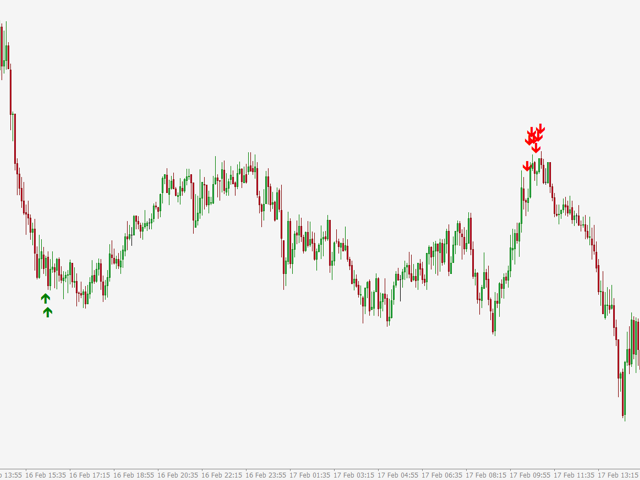
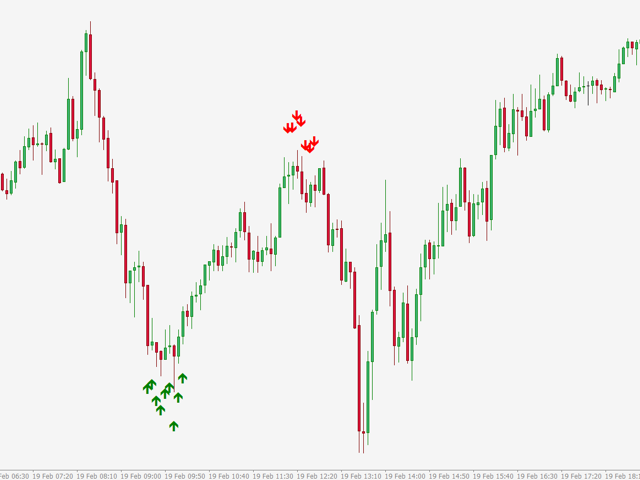
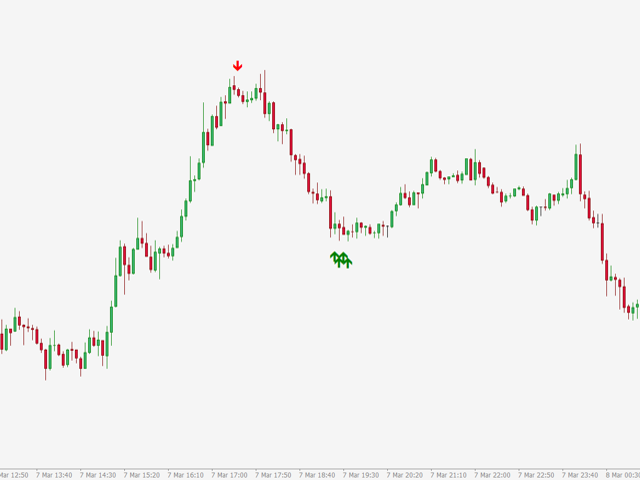
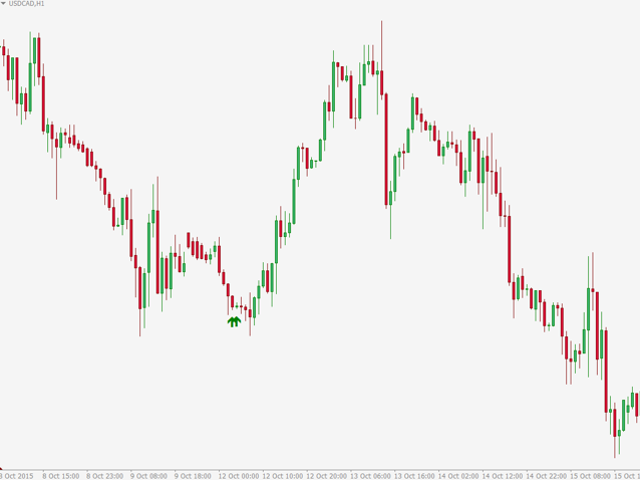
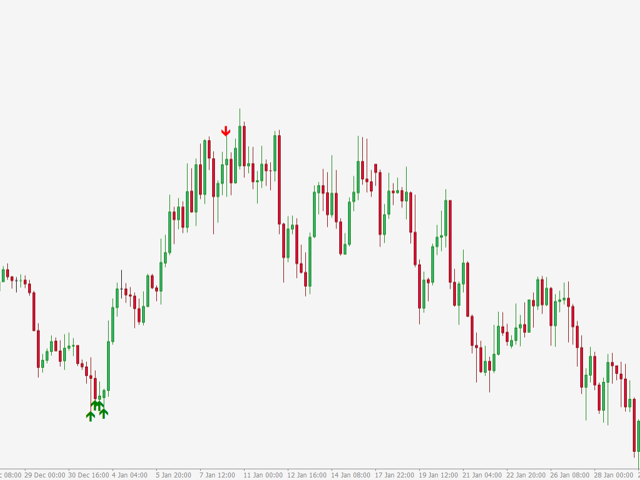
MFI Pointer simplemente dibuja flechas en la ventana del gráfico cuando el valor del Money Flow Index (del parámetro MFI_Period) está por debajo de MFI_Level (flecha verde que apunta hacia arriba) o por encima de 100-MFI_Level (flecha roja que apunta hacia abajo). El indicador funciona en todos los marcos temporales y en todos los pares de divisas, materias primas, índices, acciones, etc.
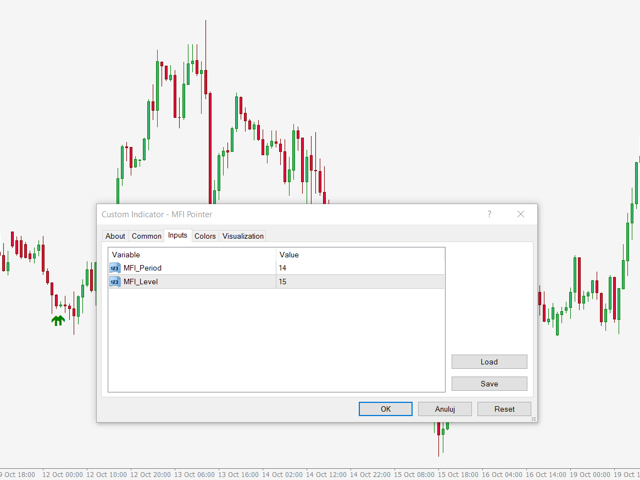
MFI Pointer tiene sólo 2 parámetros, MFI_Period y MFI_Level. Por ejemplo, si establece MFI_Period=14 y MFI_Level=10 el indicador dibujará flechas para valores por debajo de 10 (flecha verde) y por encima de 90 (flecha roja). Un nivel de MFI más alto es siempre igual a 100-MFI_Level.
MFI Pointer funciona en la ventana del gráfico, por lo que no necesita el indicador Money Flow Index en una ventana adicional separada para reconocer las condiciones extremas de MFI, que a menudo conducen a inversiones de tendencia o retrocesos. Recuerde tener siempre cuidado cuando se publiquen mensajes políticos y macroeconómicos importantes, cuando el precio oscile alrededor de niveles importantes de soporte y resistencia, pivotes o números redondos y, obviamente, preste siempre especial atención a la acción del precio.
Recuerde, nadie excepto usted mismo es responsable de cualquier decisión de inversión que tome. Usted es responsable de su propia investigación y decisiones de inversión. Le deseamos buena suerte.