Spread Display
- Indicadores
-
Dominik Mandok
 Forex, Commodities, Equities and Indices Trader, Programmer and Developer @ theinvestbay.com
 - Versión: 1.1
- Actualizado: 30 noviembre 2021
- Activaciones: 10
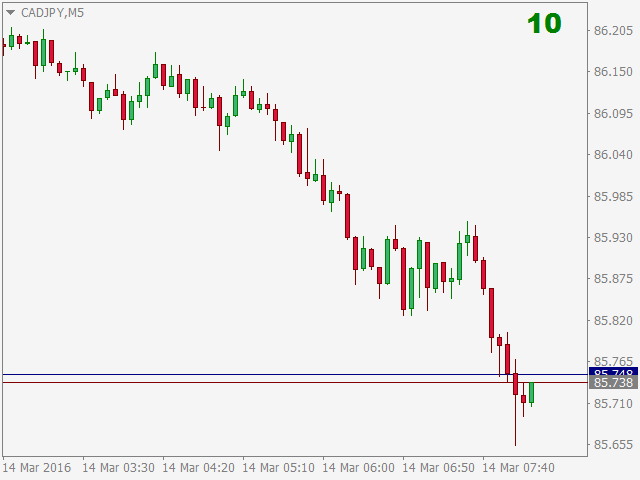
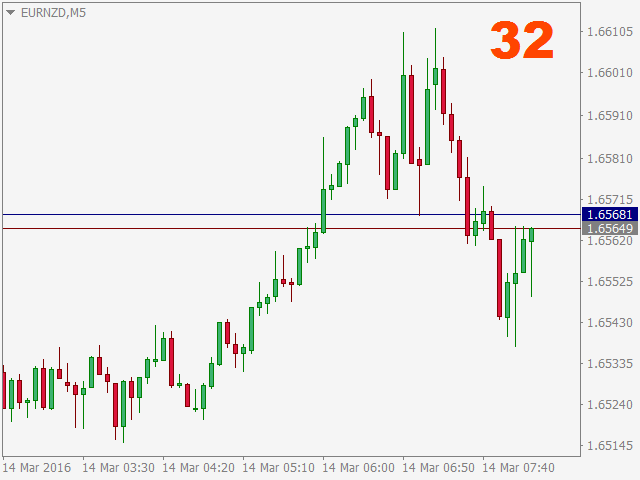
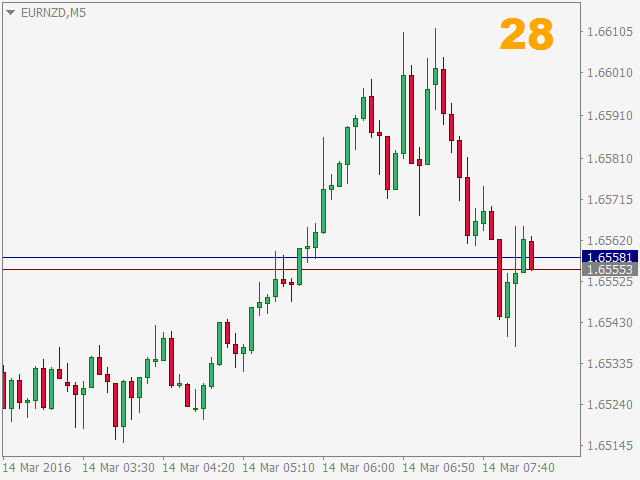
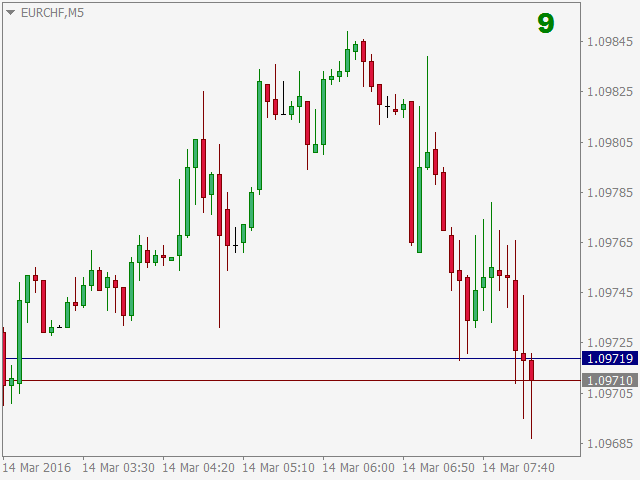
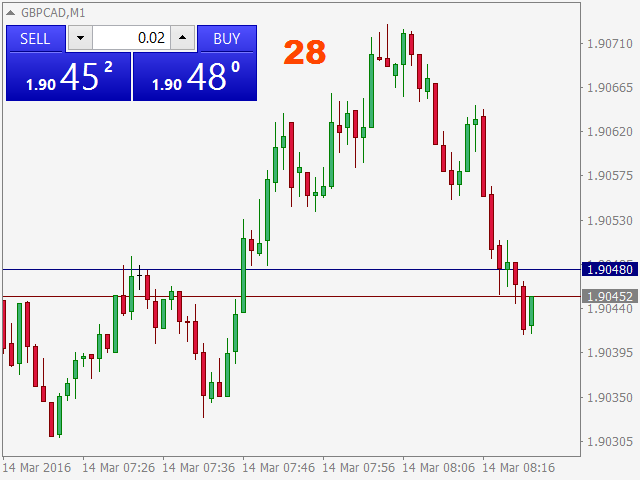
Spread Display es un indicador sencillo pero muy útil que permite monitorizar en directo el spread en la ventana del gráfico. Usando este indicador, no hay necesidad de distraer la atención nunca más, buscando el valor actual del spread en otra parte. A partir de ahora, todo está claro y a la altura de sus ojos, en la ventana del gráfico del par de divisas seleccionado.
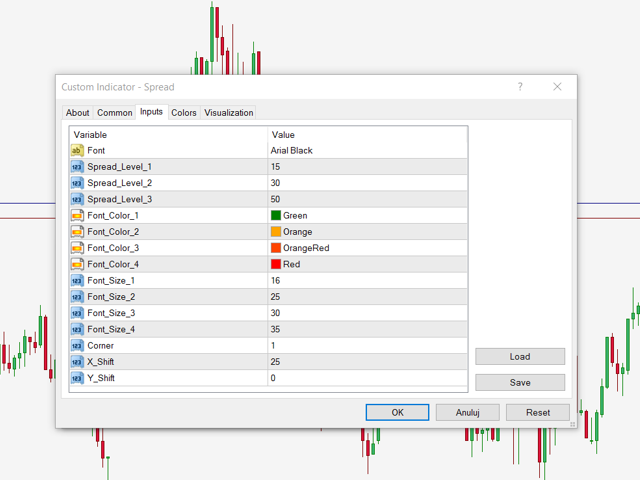
El indicador tiene muchos ajustes. Podemos elegir cualquier fuente que queramos y podemos establecer 3 niveles de spread(Spread_Level_1, Spread_Level_2 y Spread_Level_3) entre los cuales cambiará el tamaño y el color de la fuente del spread mostrado. Podemos establecer 4 valores diferentes de tamaño y color de fuente. El primero está relacionado con valores de pliego inferiores a Spread_Level_1, el segundo - entre Spread_Level_1 y 2, el tercero - entre Spread_Level_2 y 3 y, por supuesto, el cuarto para valores de pliego superiores a Spread_Level_4. También puede establecer la posición del indicador seleccionando la esquina de la ubicación y los desplazamientos en los ejes x e y.


El usuario no ha dejado ningún comentario para su valoración