Envelopes Grid
- Indicadores
-
Dominik Mandok
 Forex, Commodities, Equities and Indices Trader, Programmer and Developer @ theinvestbay.com
 - Versión: 1.1
- Actualizado: 30 noviembre 2021
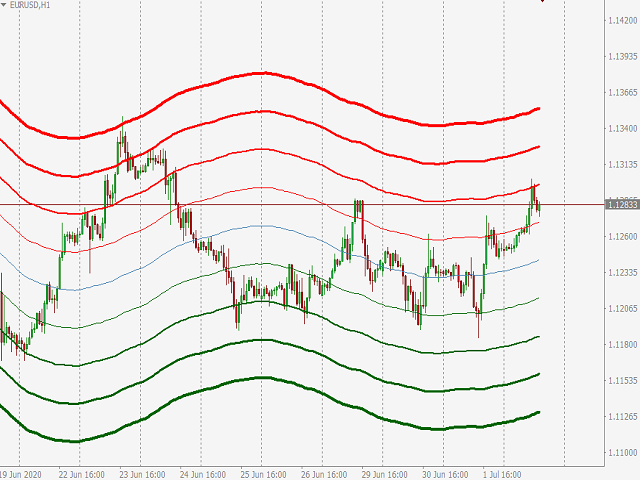
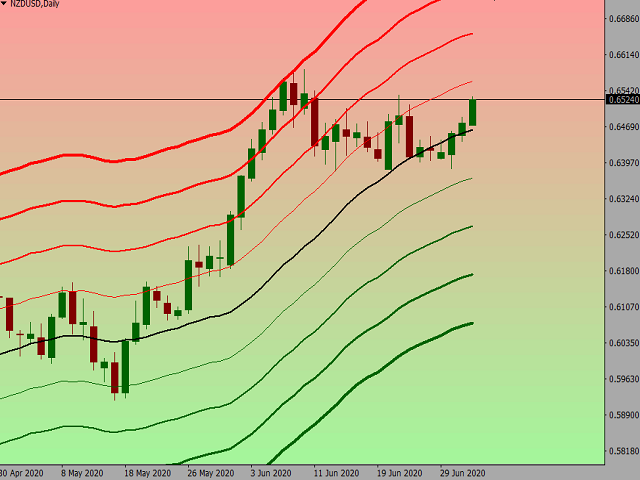
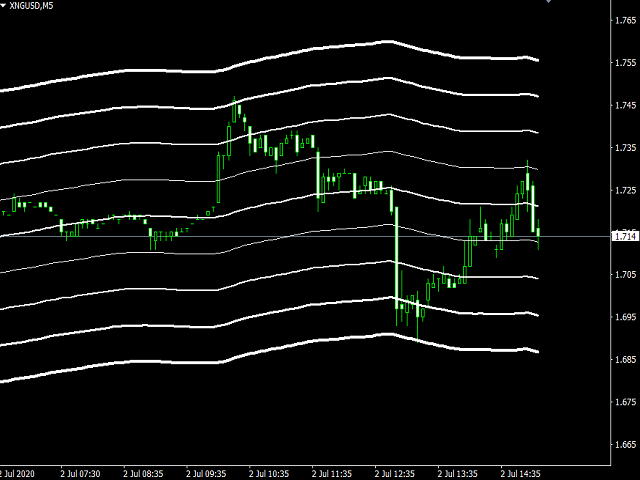
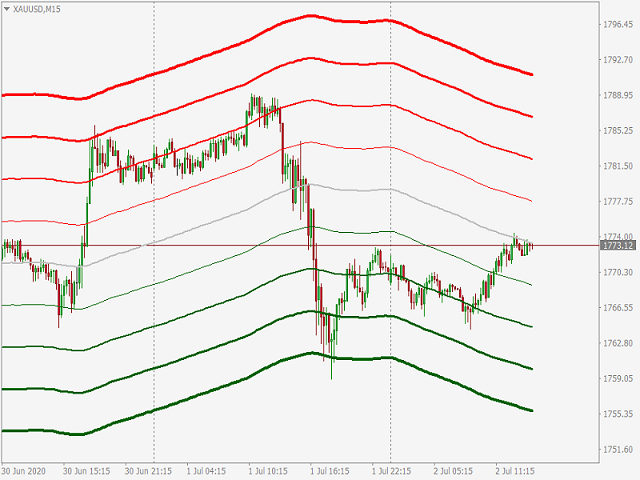
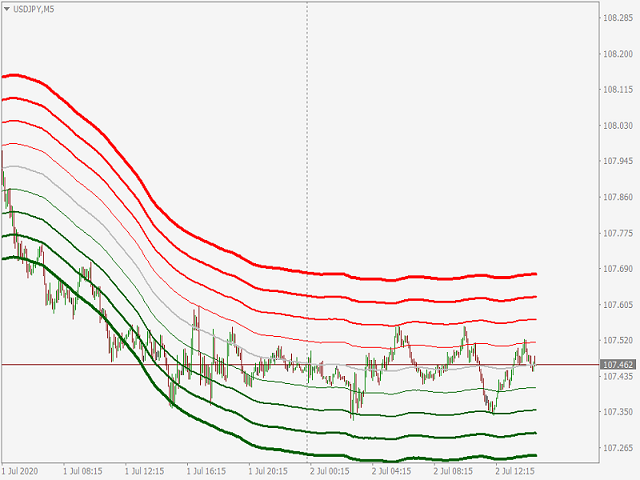
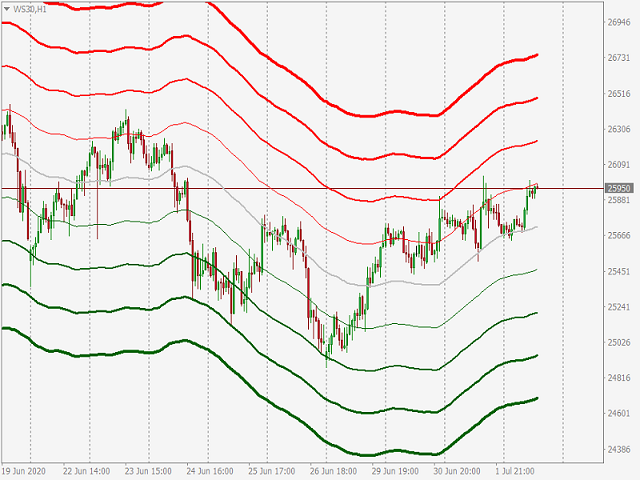
Es una herramienta sencilla pero útil para crear una rejilla basada en Sobres.
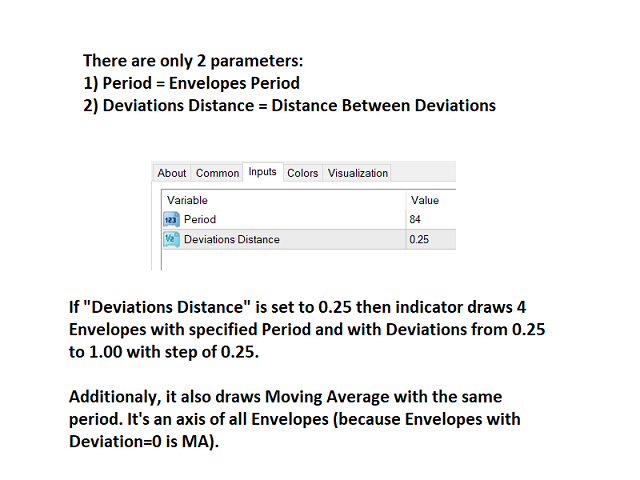
Sólo se pueden establecer 2 parámetros:
1) "Periodo" - el periodo de todas las Envolventes visibles (es decir, 4) y 1 Media Móvil (eje de las Envolventes),
2) "Distancia de las Desviaciones" - la distancia entre las Envolventes.
Naturalmente, los colores de las 9 líneas se pueden cambiar como se desee.
Funciona con todo lo que está disponible en su Market Watch.
¡Suerte!

I think it is one of the few tools that can make someone real Trader!