F trend
- Indicadores
- Versión: 1.20
- Actualizado: 31 agosto 2017
- Activaciones: 5

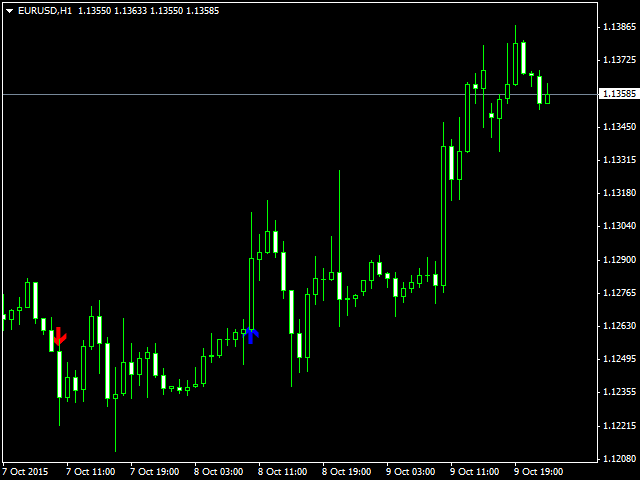
El indicador está diseñado para los aficionados al scalping, da señales de una media de diez pips. El indicador se basa en el cálculo matemático, determina el rango medio del canal de precios, que generalmente se forma en el momento de la acumulación de posiciones. Una vez que el precio se mueve más allá de sus fronteras, se genera una señal en forma de flecha. El indicador tiene un mínimo de ajustes: el período para el que necesita calcular, y la frecuencia de las señales (la frecuencia de la señal está determinada por la anchura del canal: cuanto más estrecho sea el canal, más señales se producirán; sin embargo, se recomienda utilizar sólo los valores más bajos durante los períodos planos, y es mejor aumentar el parámetro durante la tendencia para obtener señales más precisas).
Parámetros
- Período - período de cálculo del indicador.
- Multiplicador - la frecuencia de las señales (con valores más bajos las señales son más frecuentes).
- Notificación - tipo de notificación: alerta emergente, Email, Push.
- Encabezado del mensaje UP - encabezado del correo electrónico para las señales 'up'.
- Contenido del mensaje ARRIBA - texto del correo electrónico para las señales 'arriba'.
- Cabecera demensaje Abajo - cabecera de correo electrónico para las señales "Abajo".
- Contenido del mensaje Abajo - texto del correo electrónico para las señales 'Abajo'.