Consolidation levels
- Indicadores
- Versión: 1.1
- Actualizado: 23 marzo 2020
- Activaciones: 20

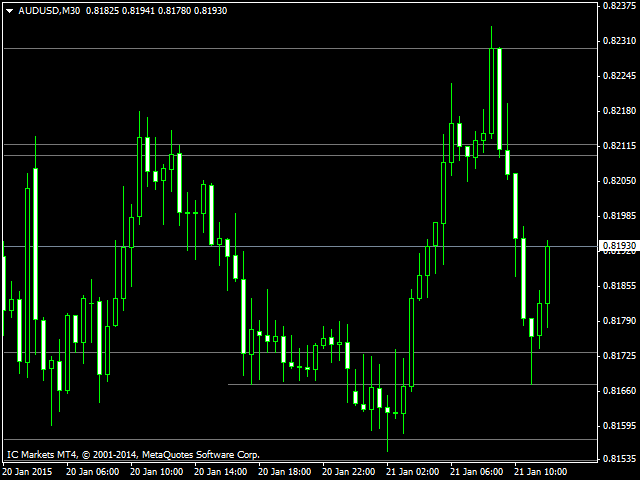
Cualquier gráfico tiene patrones de consolidación que también se denominan patrones de acumulación.
Se trata de secciones en las que el mercado ha permanecido en el mismo nivel de precios durante un periodo de tiempo significativo, por lo que estaba acumulando posiciones. Después de dicha acumulación, las posiciones se distribuyen, y el mercado pasa de plano a tendencia.
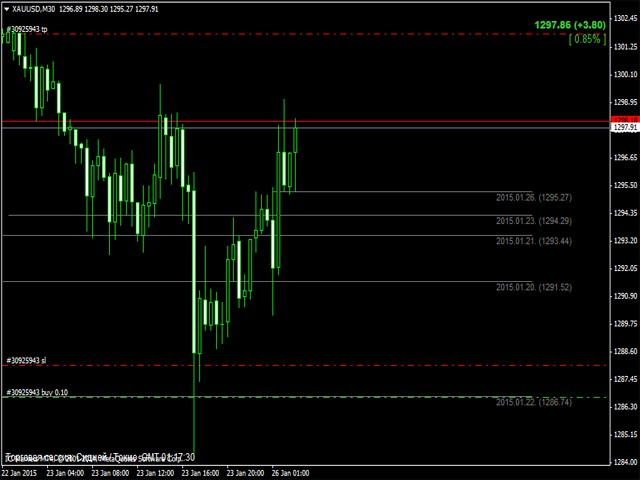
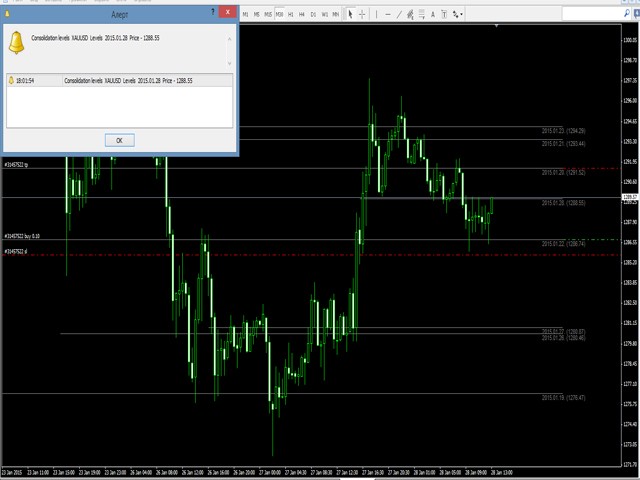
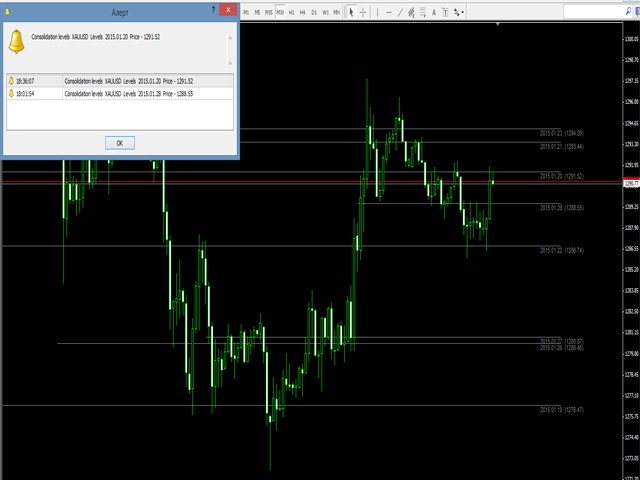
El indicador Niveles de Consolidación es una herramienta profesional que identifica estas secciones y construye niveles de acuerdo con el precio del mercado en el momento de la consolidación. Y estos niveles representan importantes niveles de soporte y resistencia.
El indicador está diseñado para operaciones intradía. El período del gráfico es de 15 minutos a 4 horas. El indicador notifica cuando el precio toca las líneas. También tiene una ventana de alerta emergente, envía notificaciones al correo electrónico, y hace Push-notificaciones (Android y iOS smartphones).
Se recomienda su uso en un gráfico de 30 minutos de cualquier instrumento de negociación.
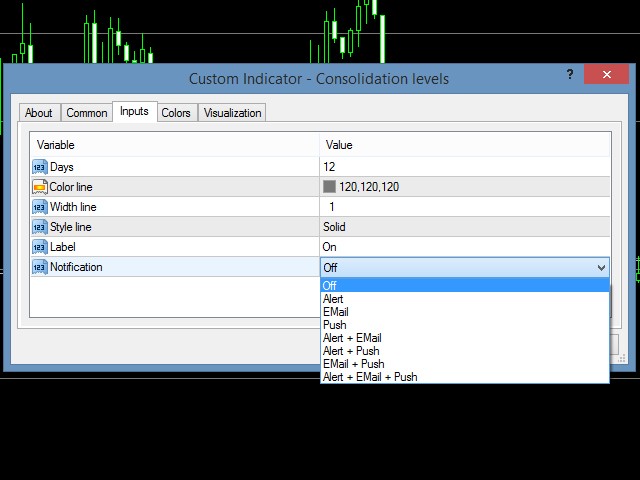
Parámetros de entrada del indicador:
- Días - Número de días para mostrar las líneas.
- Color línea - Color de las líneas.
- Ancho línea - Ancho de las líneas.
- Estilo línea - Estilo de las líneas.
- Etiqueta - Visualización de los comentarios a las líneas de fecha y precio.
- Notificación - Seleccione una notificación, alerta, envío a Email, Push-notificaciones