Beginning
- Indicadores
- Versión: 2.1
- Actualizado: 25 marzo 2020
- Activaciones: 15

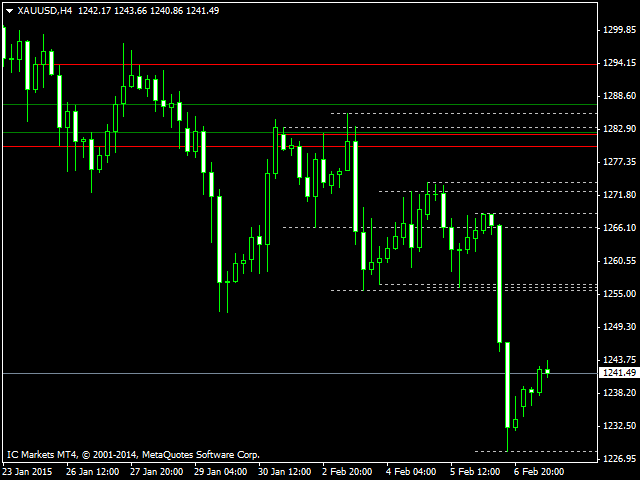
El indicador construye niveles desde principios de semana o de mes, o de acuerdo con los máximos y mínimos locales.
Estos niveles sirven para detectar fuertes niveles de soporte y resistencia en un gráfico.
La mayoría de los grandes operadores del mercado se guían especialmente por estos datos: apertura de la semana o apertura del mes.
La ruptura de uno o varios máximos y la consolidación del precio en estos niveles sugieren que el mercado tiene la intención de crecer.
La ruptura de Mínimos y la consolidación del precio evidencian la intención del mercado de moverse a la baja.
La idea de este indicador pertenece a Ilgiz Kamaev.
Parámetros:
- Número de días - Número de días para mostrar los máximos y mínimos locales.
- Color delnivel del día - Color de los niveles del día
- Ancho Línea del día - Ancho de las líneas del día
- Estilo Línea del día - Estilo de las líneas del día
- Número de semana - Número de semanas para la construcción de los niveles de semana
- Color nivel semana - Color de los niveles de semana
- AnchuraLínea semana - Anchura de las líneas de la semana
- Estilo línea semana - Estilo de las líneas de la semana
- Númerode mes - Número de meses para la construcción de niveles de mes
- Color del nivel demes - Color de los niveles de mes
- Ancho línea mes - Ancho de las líneas del mes
- Estilo línea del mes - Estilo de las líneas del mes
El usuario no ha dejado ningún comentario para su valoración