SuperTrend AI Clustering by Lux
- Indicadores
-
Minh Truong Pham
 Hello, my name is Pham and I am a programmer and trader! At here, I create amazing forex indicators and expert advisors for Metatrader.
I will try:
+ Provide best tools base on my 5 years experience as a trader and 10 years as a programmer. - Versión: 1.1
- Actualizado: 31 agosto 2023
- Activaciones: 5
El indicador SuperTrend AI es una novedosa forma de tender puentes entre el método de aprendizaje automático K-means clustering y los indicadores técnicos. En este caso, aplicamos la agrupación de K-Means al famoso indicador SuperTrend.
🔶 USO
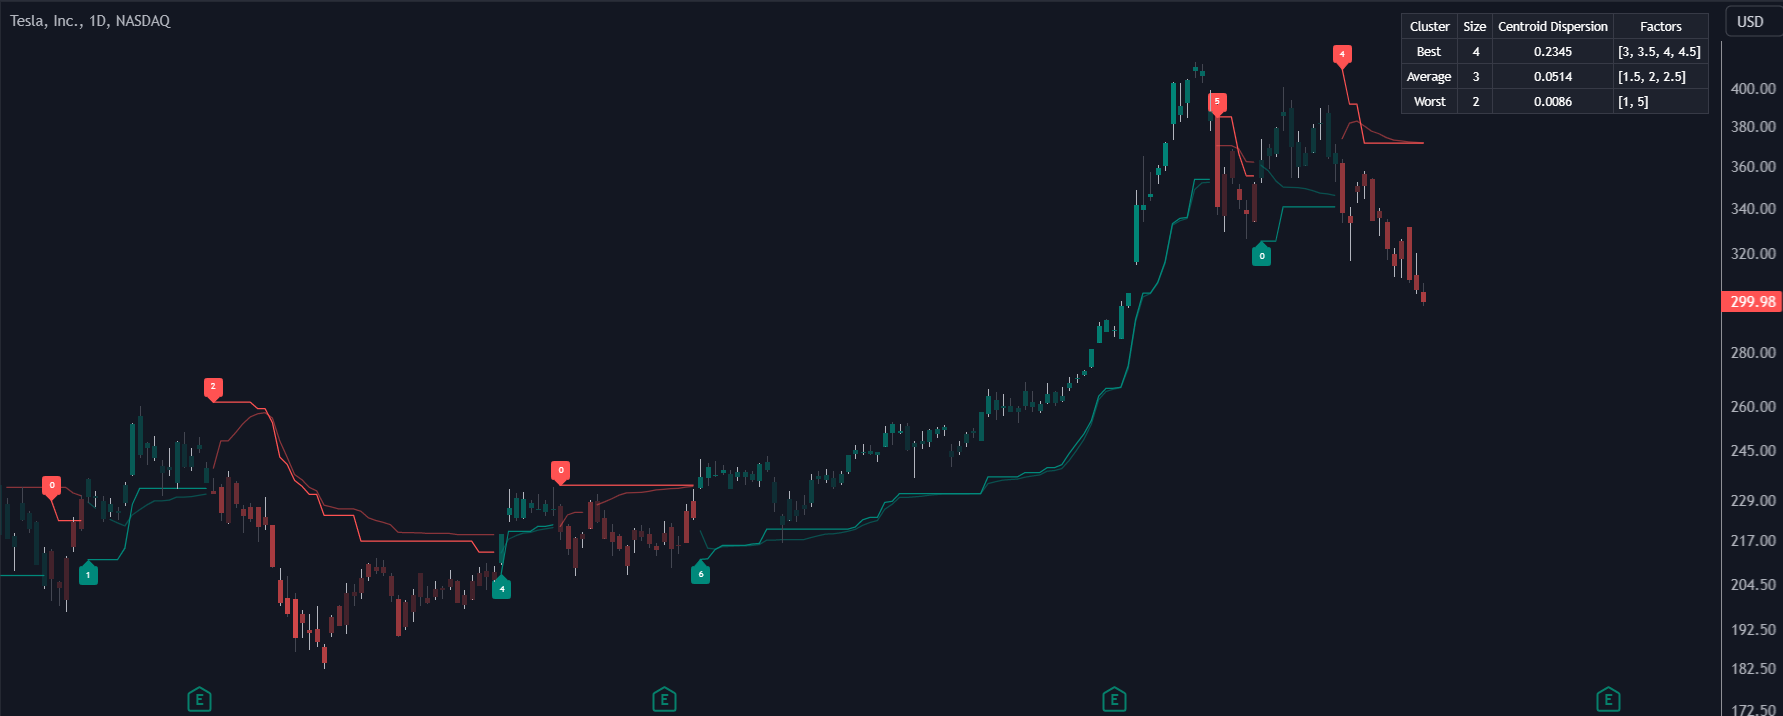
Los usuarios pueden interpretar el trailing stop de SuperTrend AI de forma similar al indicador SuperTrend normal. El uso de factores mínimos/máximos más altos devolverá señales a más largo plazo. (imagen 1)
Las métricas de rendimiento mostradas en cada señal permiten una interpretación más profunda del indicador. Mientras que los valores más altos podrían indicar un mayor potencial para que el mercado se dirija en la dirección de la tendencia en comparación con las señales con valores más bajos, como 1 o 0, que podrían indicar retrocesos. (imagen 2)
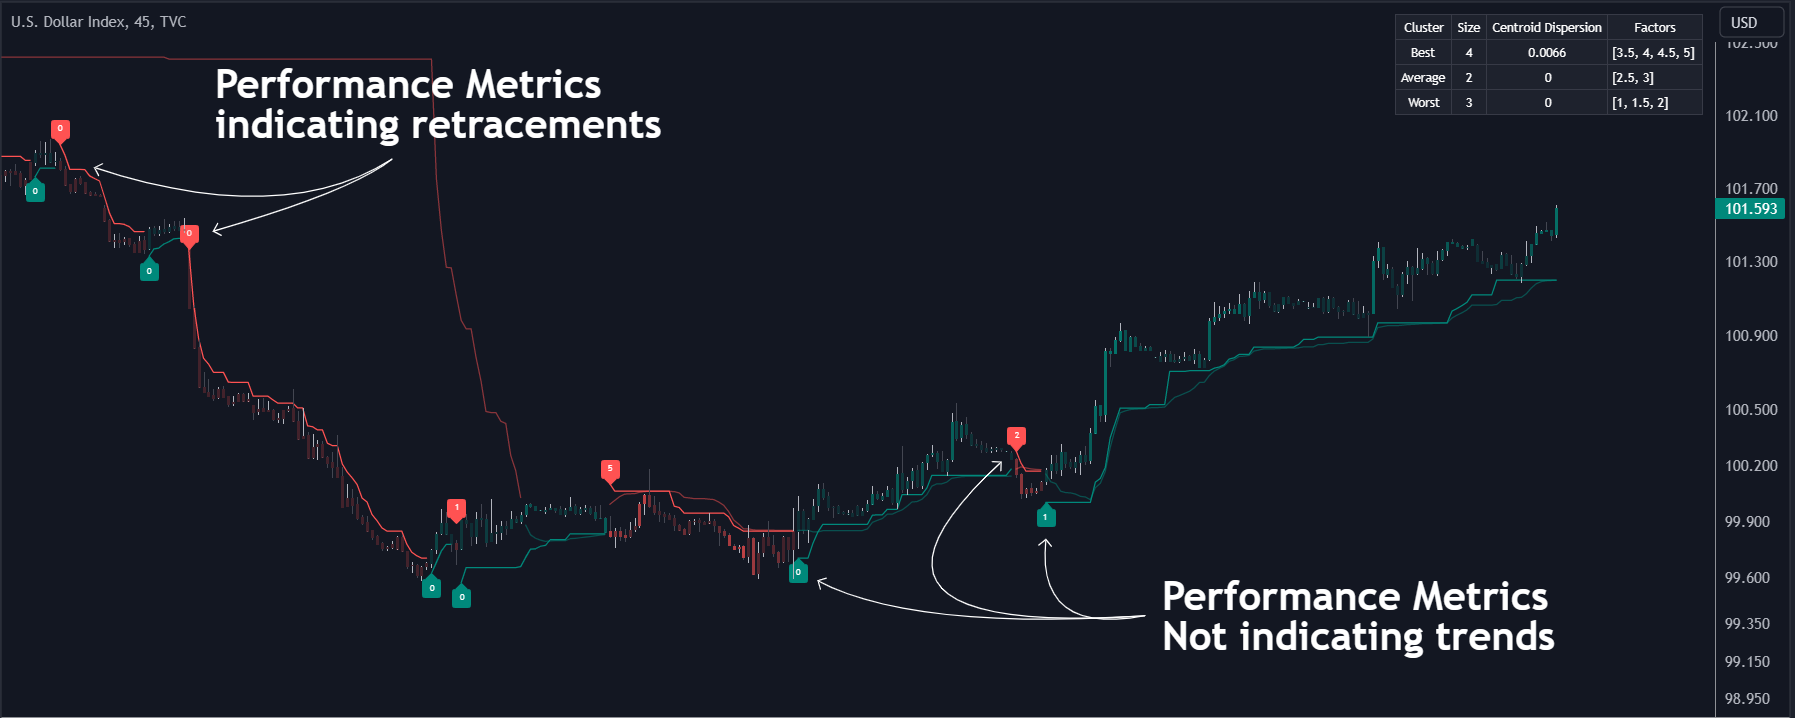
En la imagen anterior, podemos observar ejemplos más claros de las métricas de rendimiento en señales que indican tendencias, sin embargo, estas métricas de rendimiento no pueden realizar o predecir cada señal de forma fiable. (imagen 3)
Podemos ver en la imagen superior que el trailing stop y su media móvil adaptativa también pueden actuar como soporte y resistencia. El uso de valores más altos de la configuración de la memoria de rendimientopermite a los usuarios obtener una media móvil adaptativa a más largo plazo del trailing stop devuelto.
🔶 DETALLES
🔹 K-Means Clustering (imagen 4)
Existen varios métodos para encontrar clusters dentro de los datos, siendo el utilizado en este scriptelK-MeansClustering, un simple método iterativo de clustering no supervisado que encuentra una cantidad de clusters establecida por el usuario.
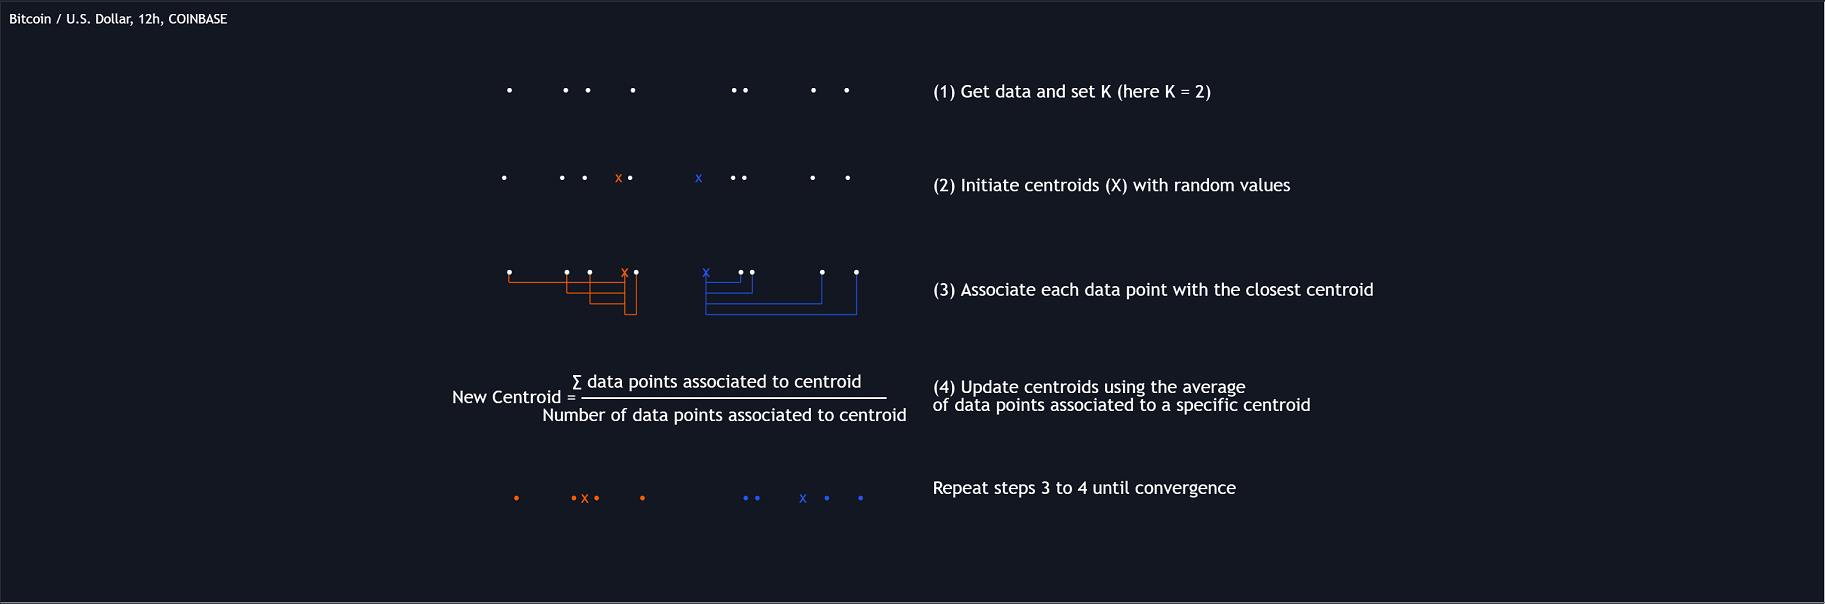
Unaforma ingenua del algoritmo K-Means realizaría los siguientes pasos para encontrarK clusters :
- (1) Determinar la cantidad (K) de clusters a detectar.
- (2) Iniciar nuestros K centroides (centros de cluster) con valores aleatorios.
- (3) Hacer un bucle sobre los puntos de datos, y determinar cuál es el centroide más cercano de cada punto de datos, a continuación, asociar ese punto de datos con el centroide.
- (4) Actualice los centroides tomando la media de los puntos de datos asociados a un centroide específico.
- Repita los pasos 3 a 4 hasta la convergencia, es decir, hasta que los centroides ya no cambien.
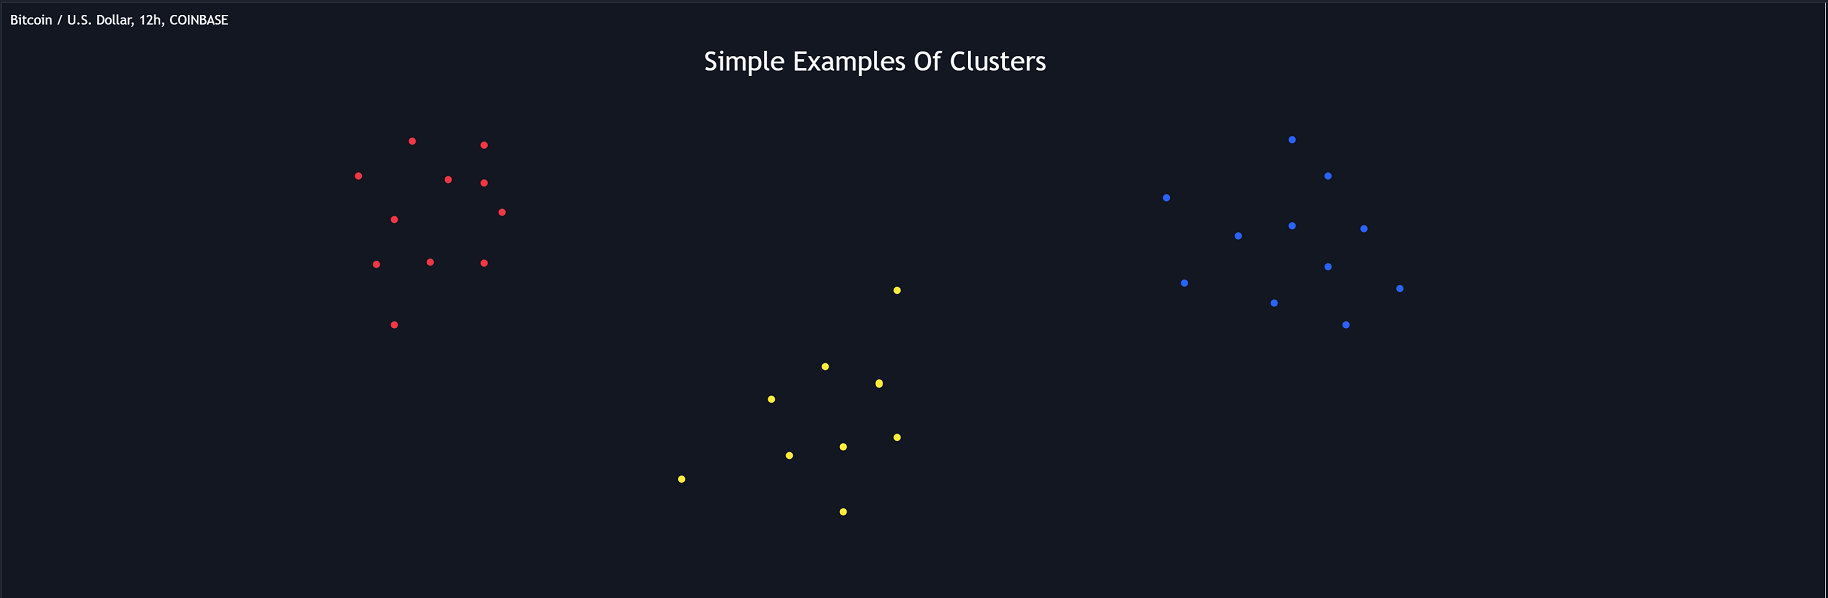
Para explicar gráficamente cómo funciona K-Means, tomemos el ejemplo de un conjunto de datos unidimensional (que es la dimensión utilizada en nuestro script) con dos clusters aparentes: (imagen 5)
Se trata, por supuesto, de un escenario simple, ya queK será generalmente mayor, así como la cantidad de puntos de datos. Tenga en cuenta que este método puede ser muy sensible a la inicialización de los centroides, esta es la razón por la que generalmente se ejecuta varias veces, manteniendo la ejecución que devuelve los mejores centroides.🔹 Adaptive SuperTrend Factor Using K-Means
El razonamiento del indicador propuesto se basa en la siguiente hipótesis:
Dadas múltiples instancias de un indicador utilizando diferentes configuraciones, la elección de la configuración óptima en el momentot viene dada por la instancia de mejor rendimiento con la configuración s (t).
Si se calcula el indicador con la mejor configuración en el momentot, se obtiene un indicador cuyas características se adaptan en función de su rendimiento. Sin embargo, ¿qué ocurre si la configuración de la instancia de mejor rendimiento y la segunda instancia de mejor rendimiento del indicador tienen un alto grado de disparidad sin una gran diferencia en el rendimiento?
Aunque este caso específico es raro, no es raro ver que el rendimiento puede ser similar para un grupo de configuraciones específicas (esto podría observarse en un mapa térmico de optimización de parámetros), entonces filtrar las configuraciones deseables para utilizar sólo la de mejor rendimiento puede parecer demasiado estricto. Por tanto, podemos reformular nuestra primera hipótesis:
Dadas múltiples instancias de un indicador que utilizan diferentes configuraciones, la elección de la configuración óptima en el momentot viene dada por la media de las instancias con mejores resultados con configuraciones s (t).
La búsqueda de este grupo de instancias con mejor rendimiento podría realizarse utilizando el método de agrupación K-Means descrito anteriormente, suponiendo tres grupos de interés (K = 3) definidos como peor rendimiento, rendimiento medio y mejor rendimiento.
En primer lugar, obtenemos un análogo del rendimiento P (t, factor) descrito como:
P(t, factor) = P(t-1, factor) + α * (∆C(t) × S(t-1, factor) - P(t-1, factor))donde 1 > α > 0, que es la memoria de rendimiento que determina el grado en que las entradas más antiguas afectan a la salida actual. C(t) es el precio de cierre, y S (t, factor) es la función generadora de señales SuperTrend con factor multiplicativo .
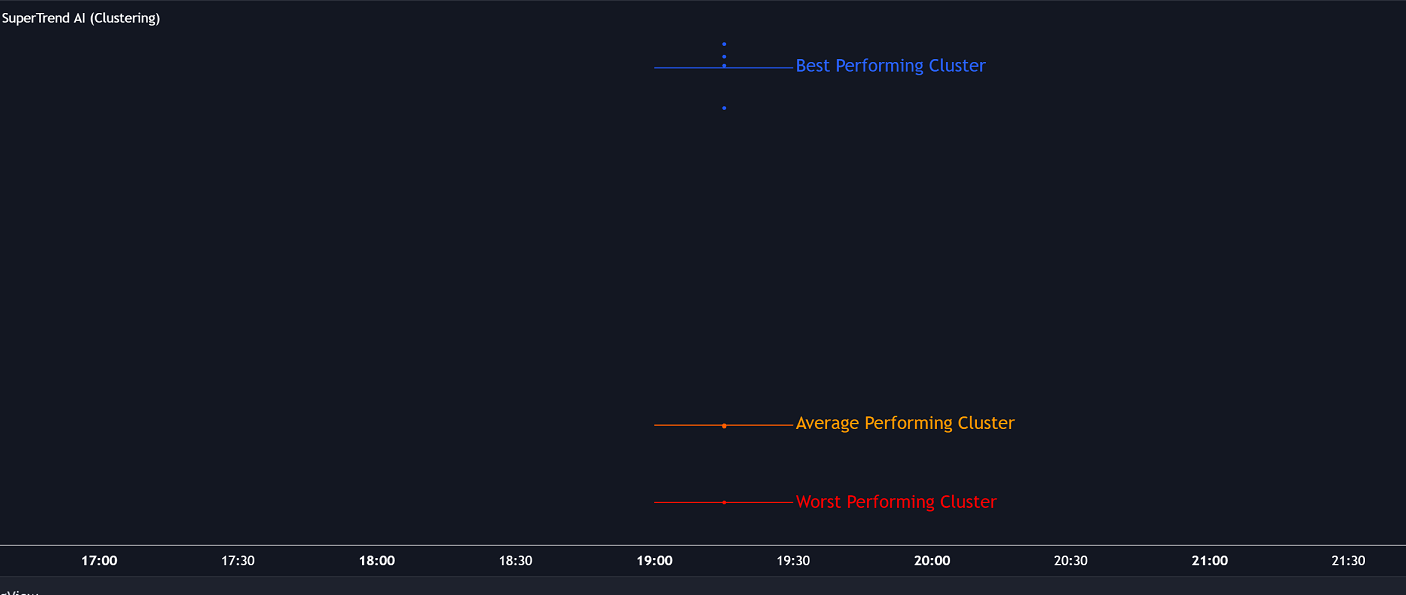
Ejecutamos esta función de rendimiento para múltiples configuraciones de factoresy realizamos una agrupación de K-Means en los múltiples rendimientos obtenidos para obtener la agrupación de mejor rendimiento. Iniciamos nuestros centroides utilizando cuartiles de los rendimientos obtenidos para una convergencia más rápida de los centroides. (imagen 6)
Tenga en cuenta que damos la libertad al usuario para obtener el factor final del mejor, promedio o peor cluster con fines experimentales.
🔶 SETTINGS
- ATR Length: Periodo ATR utilizado para el cálculo de las SuperTendencias.
- Rango de Factores: Determina los valores mínimo y máximo del factor para el cálculo de las SuperTendencias.
- Escalón: Incrementos del rango de factores.
- Memoria de Rendimiento: Determina el grado en que las entradas más antiguas afectan a la salida actual, con valores más altos que devuelven medidas de rendimiento a más largo plazo.
- De Cluster: Determinar qué clúster se utiliza para obtener el factor final.
🔹 O ptimización
Este grupo de ajustes afecta al rendimiento en tiempo de ejecución del script.
- Pasos máximos de iteración: Número máximo de iteraciones permitidas para encontrar centroides. Valores excesivamente bajos pueden producir un mejor tiempo de carga del script pero un clustering pobre.
- Cálculo de Barras Históricas (lookback): Ventana de cálculo del script (en barras). Valores superiores a 500 pueden causar un rendimiento lento. Probado a 300 para un mejor resultado.