Liquidity Swings
- Indicadores
-
Minh Truong Pham
 Hello, my name is Pham and I am a programmer and trader! At here, I create amazing forex indicators and expert advisors for Metatrader.
I will try:
+ Provide best tools base on my 5 years experience as a trader and 10 years as a programmer. - Versión: 1.3
- Actualizado: 24 diciembre 2023
- Activaciones: 5
El indicador de oscilaciones de liquidez destaca las zonas de oscilación con actividad comercial existente. El número de veces que el precio ha vuelto a visitar una zona de oscilación se destaca mediante una zona que delimita las zonas de oscilación. Además, el volumen acumulado en las zonas de oscilación se destaca mediante etiquetas en el gráfico. También se incluye una opción para filtrar las áreas de oscilación con volumen/recuentos que no alcanzan un umbral establecido por el usuario.
Este indicador, por su propia naturaleza, no es en tiempo real y está pensado para el análisis descriptivo junto con otros componentes del script. Este es el comportamiento normal de los scripts que detectan pivotes como parte de un sistema y es importante que sea consciente de que las etiquetas de pivote no están diseñadas para operar en tiempo real.
🔶 USO
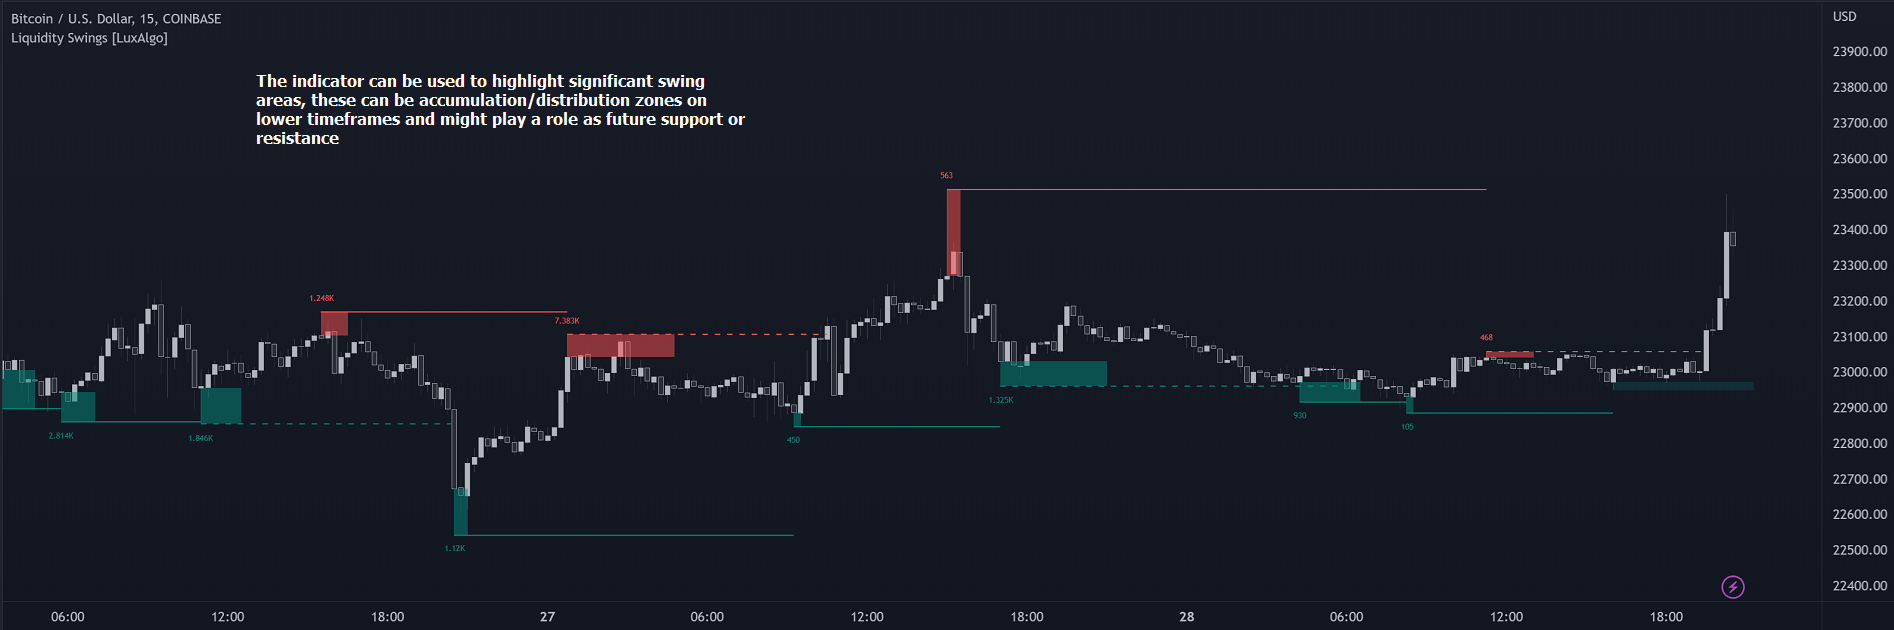
El indicador se puede utilizar para resaltar áreas de oscilación significativas, estas pueden ser zonas de acumulación/distribución en plazos inferiores y podrían desempeñar un papel como soporte o resistencia en el futuro. (imagen 1)
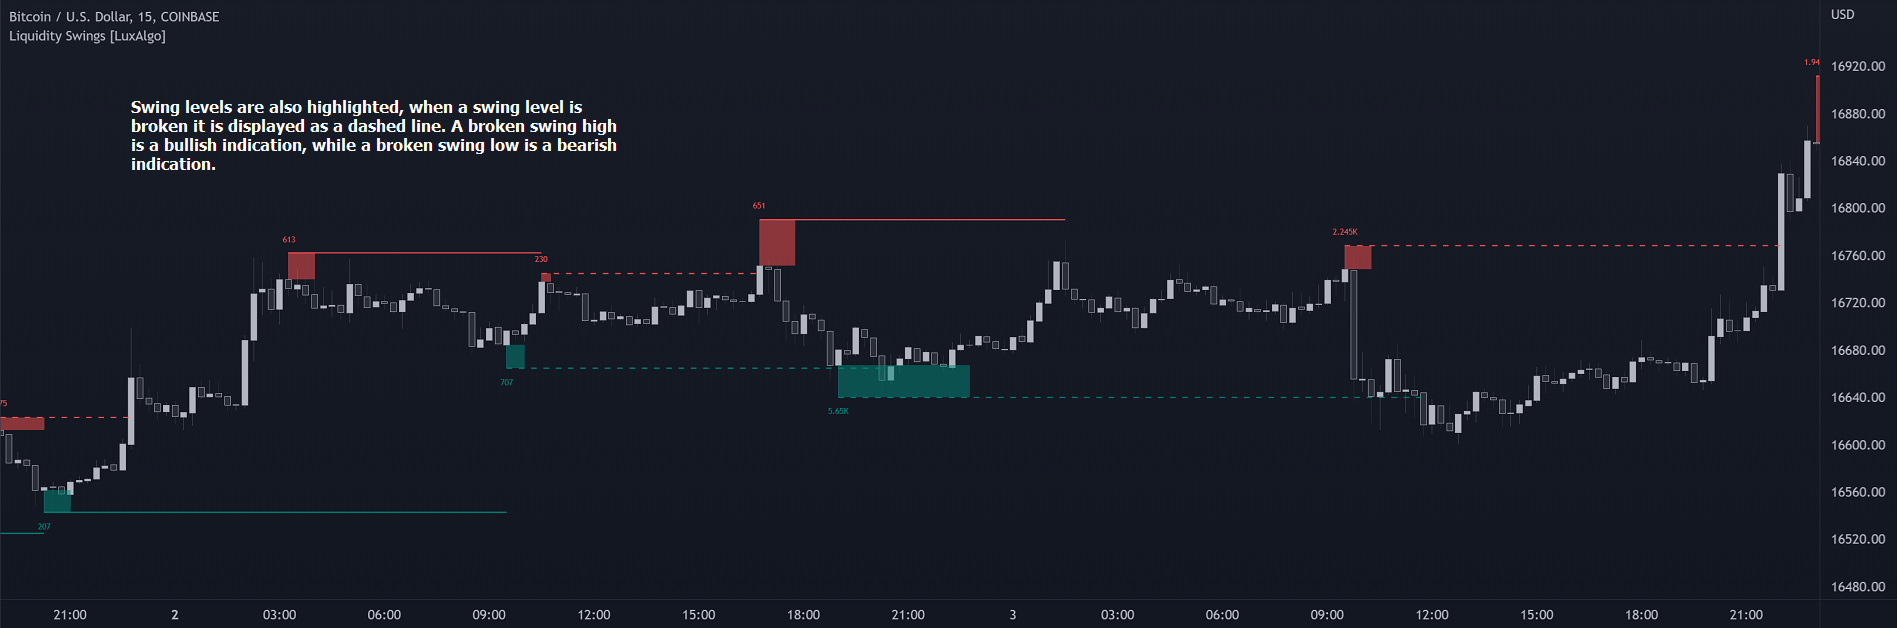
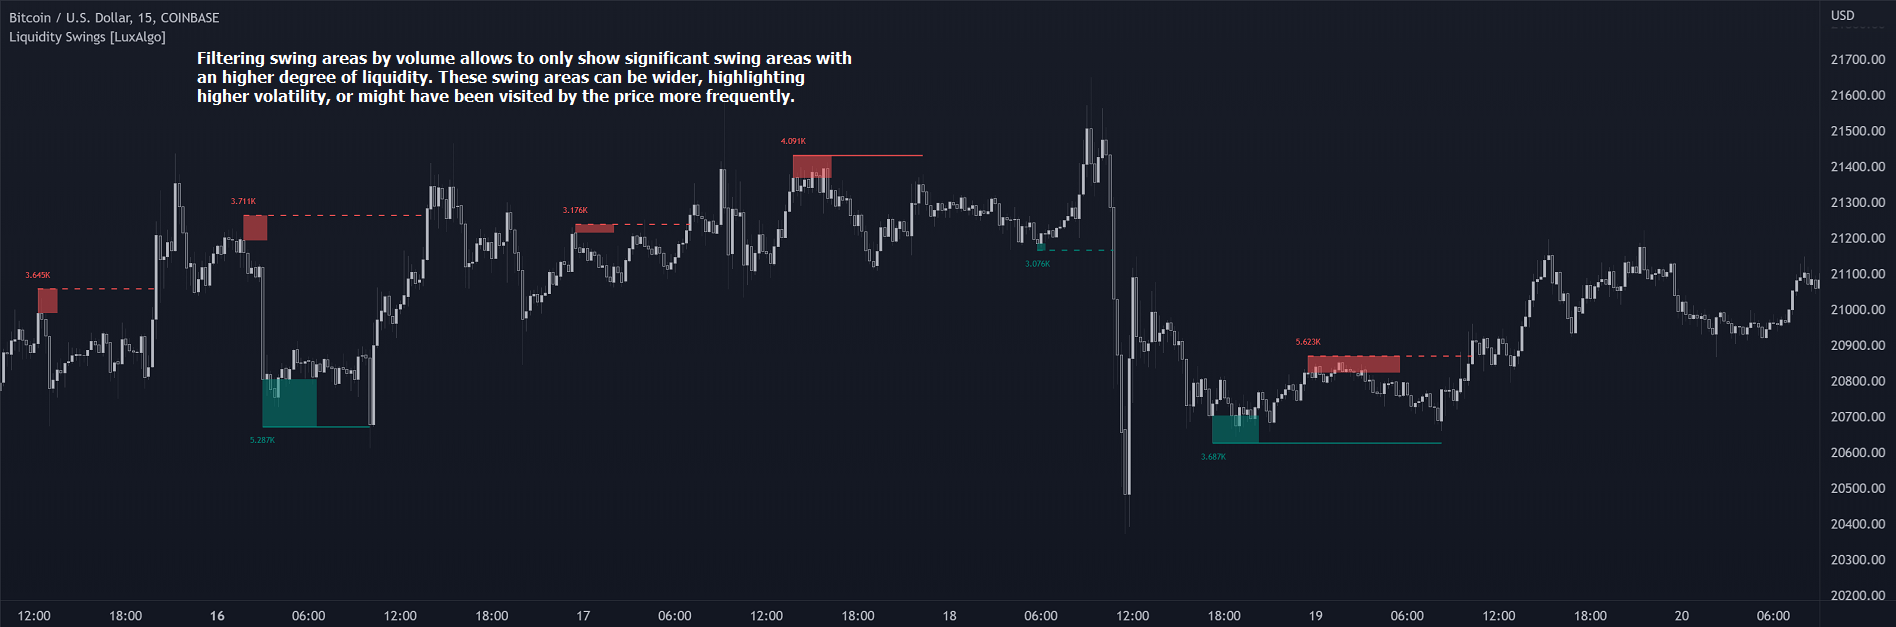
Los niveles de oscilación también se destacan, cuando un nivel de oscilación se rompe se muestra como una línea discontinua. Un máximo oscilante roto es una indicación alcista, mientras que un mínimo oscilante roto es una indicación bajista. (Imagen 2)Filtrar las zonas de oscilación por volumen permite mostrar únicamente las zonas de oscilación significativas con un mayor grado de liquidez. Estas zonas de oscilación pueden ser más amplias, lo que pone de manifiesto una mayor volatilidad, o pueden haber sido visitadas por el precio con mayor frecuencia. (Imagen 3)
🔶 AJUSTES
- Pivot Lookback : Periodo de retroceso utilizado para el cálculo de los puntos pivote.
- Swing Area : Determina cómo se calcula el área de oscilación, "Wick Extremity" utilizará el rango desde el precio alto hasta el máximo entre el precio de cierre/apertura en caso de un swing alto, y el rango desde el precio bajo hasta el mínimo entre el precio de cierre/apertura en caso de un swing bajo. "Rango Completo" utilizará el rango completo de la vela como área de swing.
- Precisión Intrabar : Utiliza datos intrabar para calcular el volumen acumulado dentro de un área de swing, esto permite obtener resultados más precisos.
- Filtrar Áreas Por : Determina cómo se filtran las áreas de swing, "Count" filtrará las áreas de swing donde el precio visitó el área un número de veces inferior al umbral establecido por el usuario. "Volumen" filtrará las áreas de swing en las que el volumen acumulado dentro del área sea inferior al umbral establecido por el usuario.
🔹 Estilo
- Swing High : Muestra los máximos de swing.
- Swing Low : Muestra los mínimos.
- Label Size : Tamaño de las etiquetas en el gráfico.
Tenga en cuenta que los puntos swing se confirman después de las barras Pivot Lookback, por lo que todos los elementos se muestran retrospectivamente.