Sessions by LUX in MT5
- Indicadores
-
Minh Truong Pham
 Hello, my name is Pham and I am a programmer and trader! At here, I create amazing forex indicators and expert advisors for Metatrader.
I will try:
+ Provide best tools base on my 5 years experience as a trader and 10 years as a programmer. - Versión: 1.6
- Actualizado: 18 marzo 2024
- Activaciones: 5
Este indicador muestra cuando las sesiones establecidas por el usuario están activas y devuelve varias herramientas + métricas utilizando el precio de cierre dentro de las sesiones activas como entrada. Los usuarios tienen la opción de cambiar hasta 4 tiempos de sesión.
El indicador carecerá cada vez más de precisión cuando el marco temporal del gráfico sea superior a 1 hora.
Configuración
Sesiones
Configuración de rangos
Panel de control
Divisores
El indicador carecerá cada vez más de precisión cuando el marco temporal del gráfico sea superior a 1 hora.
Configuración
Sesiones
- Habilitar Sesión: Permite habilitar o deshabilitar todos los elementos asociados a una determinada sesión establecida por el usuario.
- Hora de la sesión: Hora de apertura y cierre de la sesión establecida por el usuario en formato hh:mm.
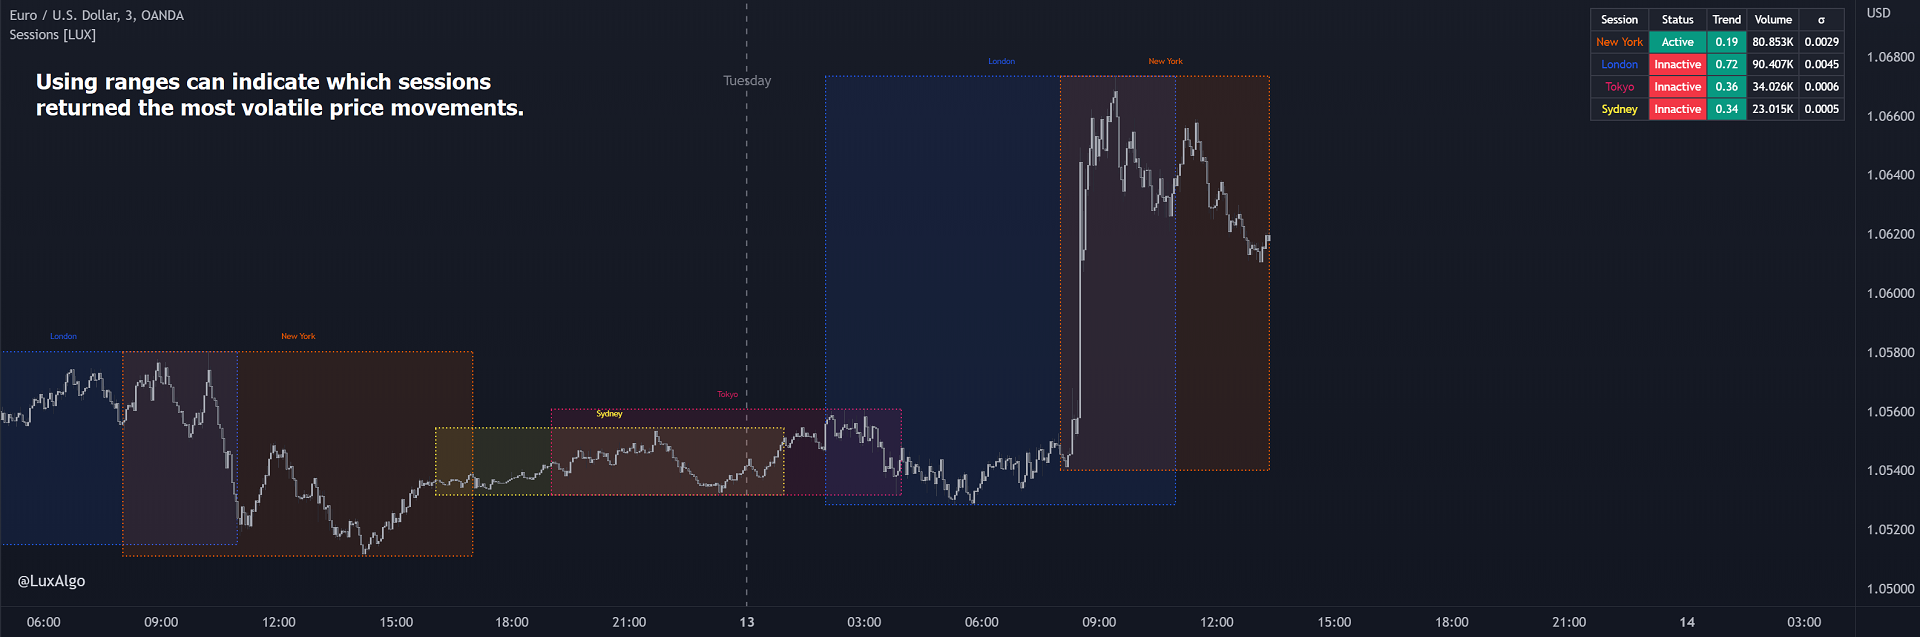
- Rango: Resalta en el gráfico el rango de la sesión asociada.
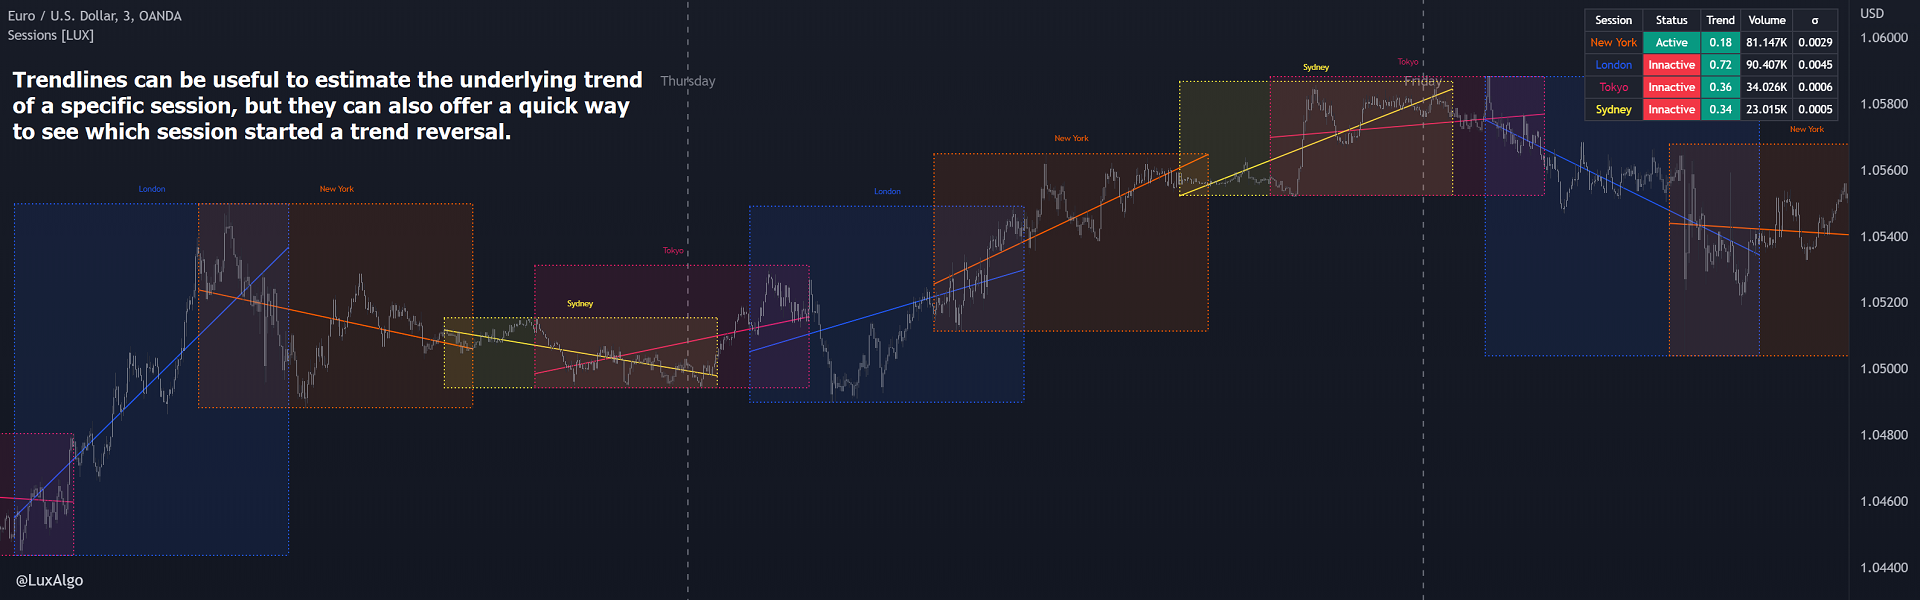
- Línea de tendencia: Resalta en el gráfico la línea de tendencia de la sesión asociada.
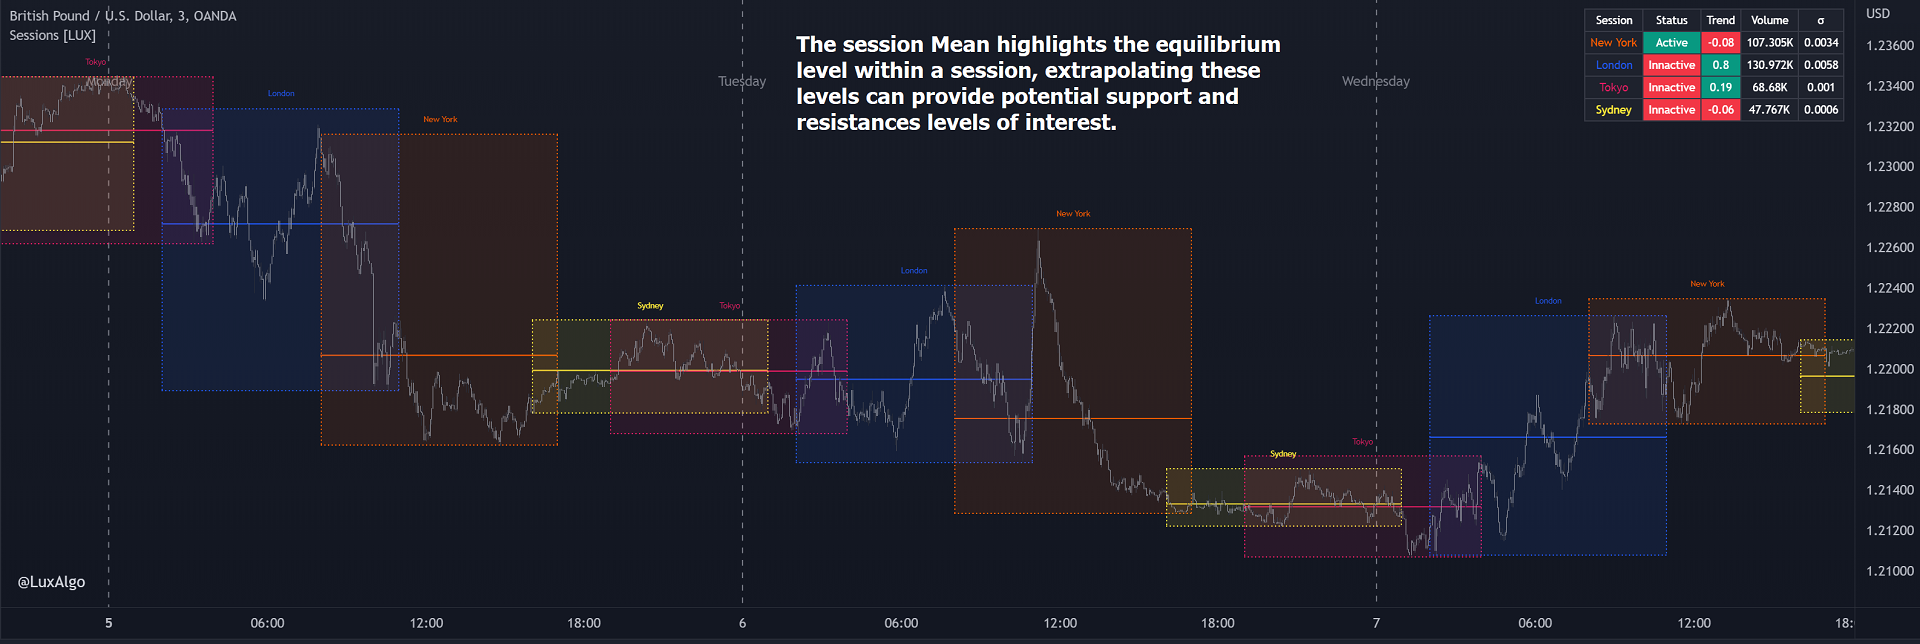
- Media: Muestra en el gráfico la media de la sesión asociada.
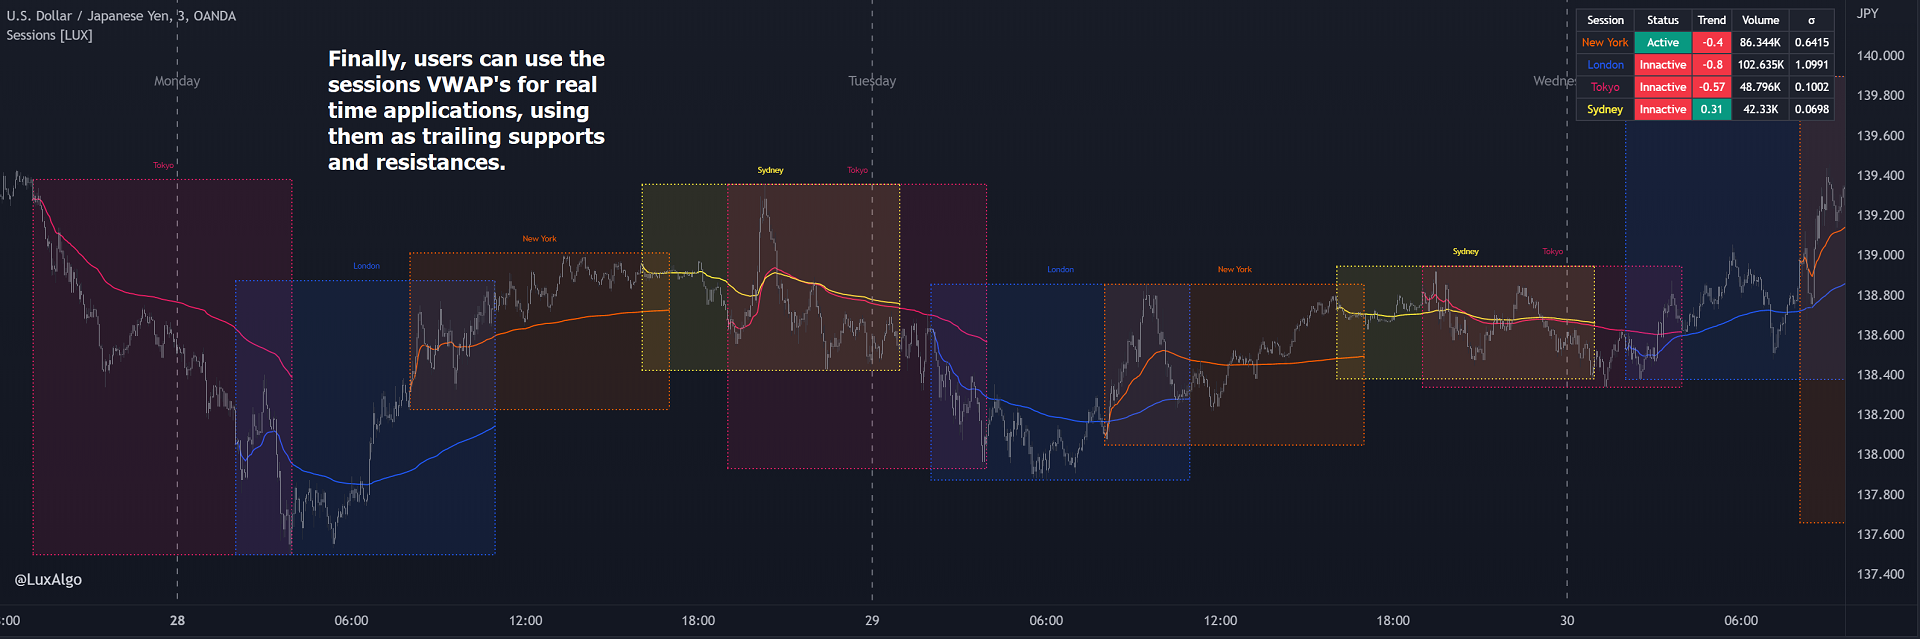
- VWAP: Muestra en el gráfico el precio medio ponderado por volumen de la sesión asociada.
Configuración de rangos
- Transparencia del área de rangos: Transparencia del área que resalta los rangos de las sesiones.
- Contorno de rangos: Resalta los bordes del área de rangos de la sesión.
- Etiqueta de rango: Muestra la etiqueta de sesión en el punto medio del intervalo de sesiones.
Panel de control
- Mostrar Panel: Activa el panel de sesiones en el gráfico.
- Panel avanzado: Muestra más información sobre las sesiones establecidas por el usuario en el panel de control.
Divisores
- Mostrar divisor de sesiones: Destaca las sesiones activas utilizando intervalos en la parte inferior del gráfico (esto puede hacer que los gráficos respondan peor).
- Mostrar divisor diario: Resalta los días en el gráfico.
Uso
Esta herramienta es versátil y permite al usuario realizar una amplia variedad de tareas, todas ellas centradas en resaltar y analizar los movimientos de precios dentro de una sesión específica establecida por el usuario de forma periódica.
Por defecto se utilizan sesiones significativas de negociación de divisas, pero los usuarios son libres de elegir la hora de apertura y cierre de su elección.
Uso del panel de control avanzado
El panel de control avanzado proporciona información útil sobre las sesiones establecidas por el usuario. A continuación se describen los elementos del panel:
- Estado: Indica si la sesión de usuario está activa (abierta) o inactiva (cerrada).
- Tendencia: Muestra el coeficiente de correlación entre los precios de la sesión y una secuencia lineal de valores. Valores superiores a 0 indican una sesión con tendencia alcista, mientras que valores inferiores a 0 indican una sesión con tendencia bajista. Los valores más próximos a (1, -1) indican una sesión más tendencial.
- Volumen: Muestra el volumen acumulado en la sesión
- σ (Desviación estándar): Muestra la desviación estándar de la sesión, aunque este valor no está acotado puede ser útil compararlo con los otros para ver qué sesión fue la más volátil.
Tenga en cuenta que cuando una sesión se vuelve inactiva el valor en el tablero se mantendrá hasta que la sesión específica vuelva a estar activa.

Excellent financial instrument that is very useful to see the sessions of the World Stock Exchanges. Helpful and collaborative author