ADX Trigger AM
- Indicadores
- Versión: 40.0
- Actualizado: 8 marzo 2026

Este indicador es una interpretación del Índice de Movimiento Direccional Medio (ADX), que ayuda a determinar la presencia de una tendencia de precios.
Fue desarrollado y descrito en detalle en el libro "New Concepts in Technical Trading Systems" de Welles Wilder.
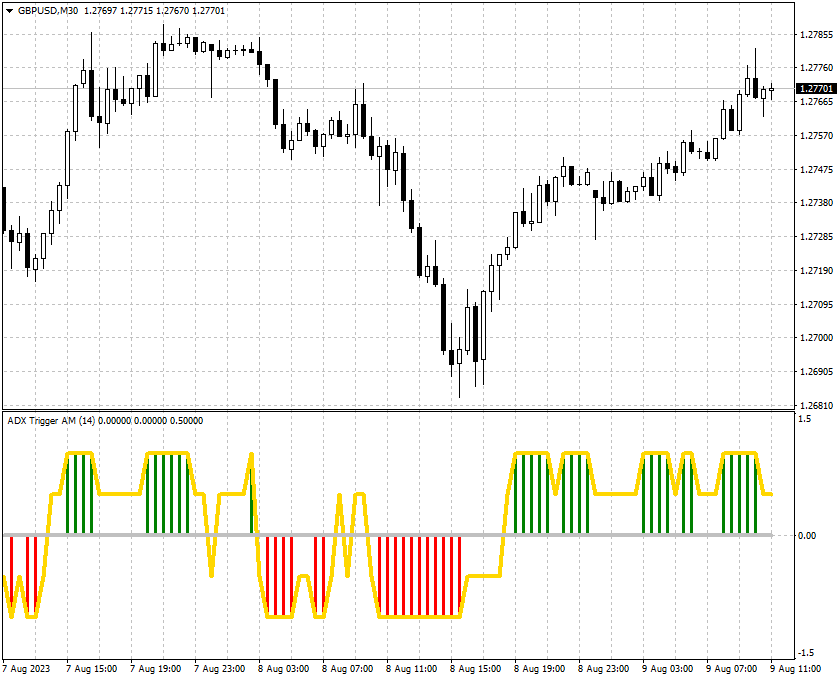
El indicador determina los puntos de entrada en el mercado, utilizando como señal la intersección de las líneas +/- del indicador ADX, así como la subida o bajada de la línea principal del indicador ADX.
El cruce de la línea cero por el indicador indica un cambio de tendencia.
Reglas de uso del indicador:
- Si el valor del oscilador es 1 - el precio está subiendo, la tendencia se mantiene;
- Si el valor del oscilador es 0,5 - el precio está subiendo, no hay tendencia;
- Si el valor del oscilador es -1 - el precio está bajando, la tendencia se mantiene;
- Si el valor del oscilador es -0,5 - el precio está bajando, no hay tendencia.
El momento óptimo de entrada es cuando el precio rompe el máximo/mínimo de la barra en la que el indicador rompe 0.
Ajustes:
ADX_Period - Periodo ADX;
ADX_Price - precio utilizado para calcular el ADX.
Atención:
Hay que tener en cuenta que cualquier mercado está en constante cambio y no hay garantía de que los métodos que fueron eficaces en el pasado lo serán en el futuro.
Para minimizar las pérdidas potenciales, debe optimizar regularmente los parámetros del producto, estudiar los resultados de su trabajo y retirar parte de los beneficios recibidos.
Se recomienda que antes de utilizar el producto en una cuenta real, pruebe su funcionamiento en una cuenta de demostración en el mismo mercado y con el mismo corredor en el que planea operar.
Con respeto y mis mejores deseos,
Andrii Matviievskyi
P.D.
Si le ha gustado este producto, le agradecería una valoración justa: las opiniones positivas de los usuarios motivan al autor, y las críticas razonables nos permiten mejorar los productos.
Le sugiero que visite mipágina donde encontrará muchas obras únicas del autor que son el resultado de muchos años de estudio del comercio de divisas y el comercio FOREX.
Thanks for sharing