Laguerre BoB AM
- Indicadores
- Versión: 40.0
- Actualizado: 4 julio 2026

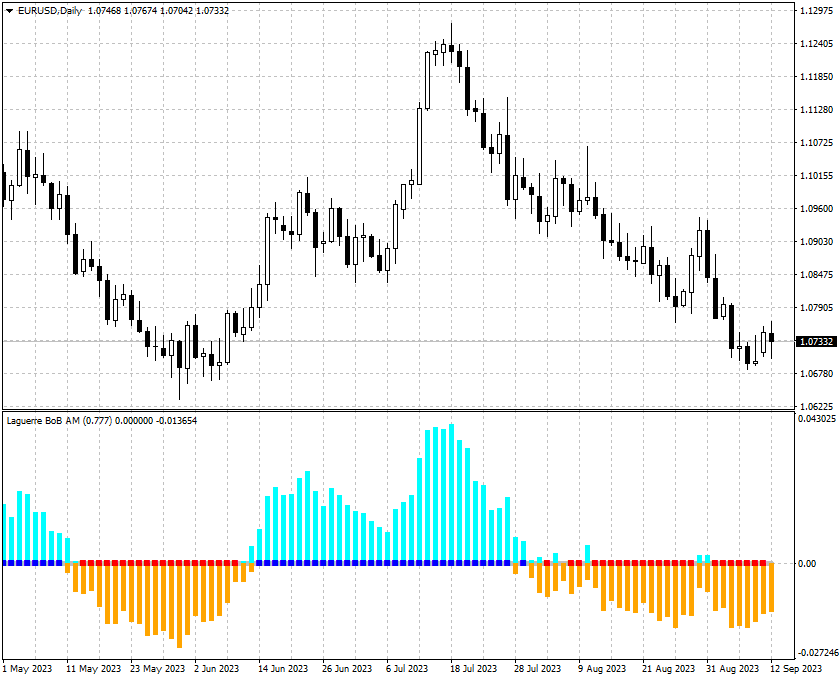
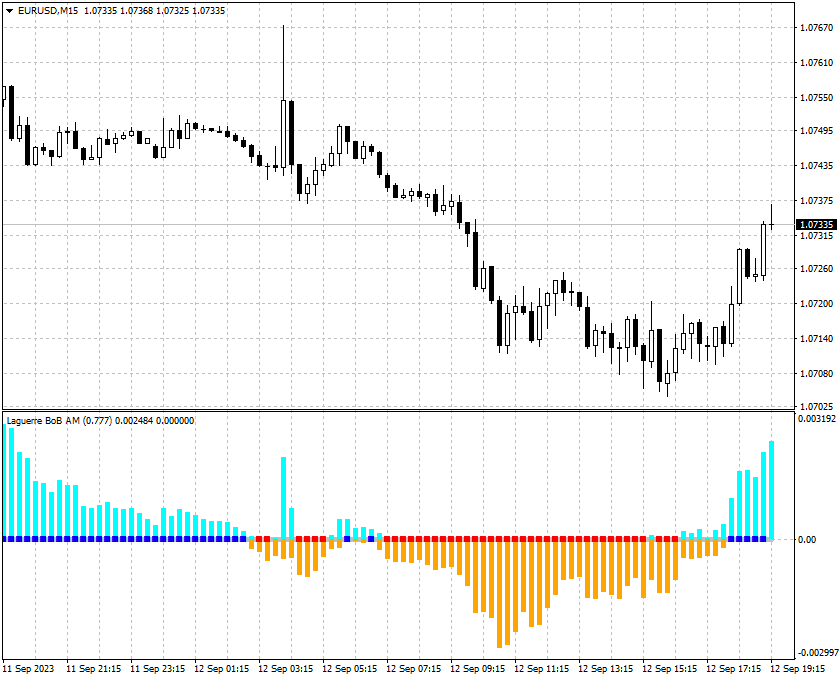
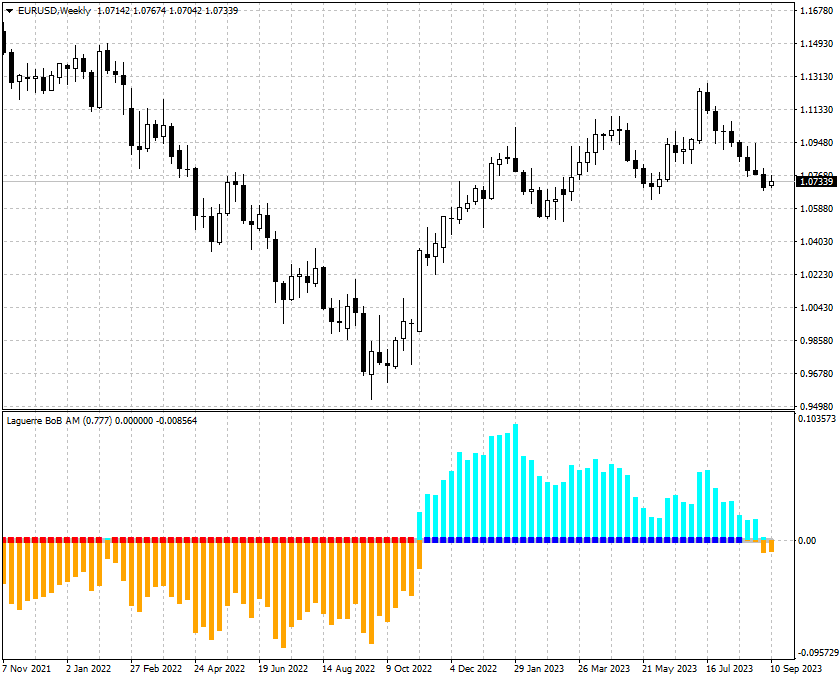
El indicador mejora la idea implementada en el indicador estándar Bulls and Bears.
Este indicador muestra la diferencia entre el Máximo y el Mínimo para el periodo de tiempo actual y los valores del canal construido en los precios máximos y mínimos, que se suavizan mediante el método de Laguerre.
El crecimiento de los valores del indicador por encima de cero indica que el Máximo del periodo actual es superior a la media de los precios Máximos.
En la mayoría de los casos, esta situación indica un aumento del valor del activo, y viceversa.
Para entrar en el mercado, espere a la primera barra en la que el valor del indicador sea mayor o menor que cero y establezca una orden pendiente para superar el Máximo o el Mínimo de la barra.
El indicador no se vuelve a pintar en barras completamente formadas.
El indicador es fácil de configurar y eficaz en los segmentos de mercado de moda.

Great little thing to have!