SyntheticIndex
- Indicadores
-
Stanislav Korotky
 Trading is just my hobby. I'm working in IT industry. So developement of experts, indicators, and script is not a problem at all to me. Wide range of technologies are used: MQL4, MQL5, system and applied programming, web-services, neural networks and more.
New: - Versión: 1.2
- Actualizado: 18 julio 2018
- Activaciones: 5
El indicador compara las cotizaciones del símbolo actual y una cotización sintética calculada a partir de dos símbolos de referencia especificados. El indicador es útil para comprobar el comportamiento de los símbolos de Forex a través de los índices bursátiles correspondientes y detectar su convergencia/divergencia, lo que puede pronosticar futuros movimientos de precios.
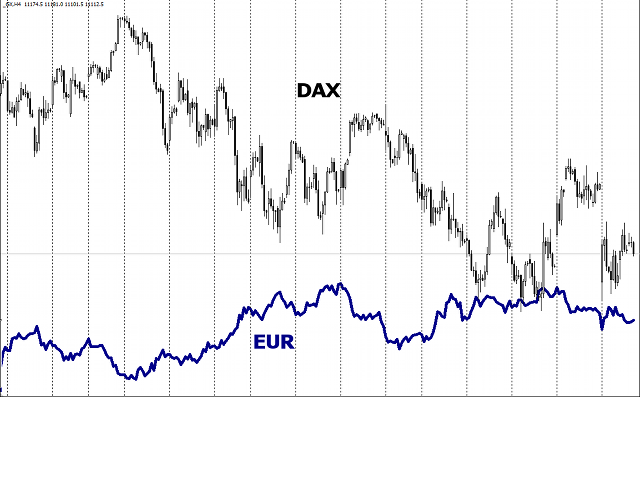
La idea principal es que todos los índices bursátiles cotizan en determinadas divisas y, por lo tanto, muestran correlación con los pares de divisas en los que se utilizan estas divisas. Cuando los creadores de mercado deciden "comprar" uno u otro índice bursátil, venden la divisa en la que cotiza el índice. Por ejemplo, la tendencia alcista del S&P500 suele verse confirmada por la tendencia bajista del USD. Y del mismo modo, el USD suele crecer cuando el S&P500 y otros índices americanos caen (puede decirse que la gente va al contado). Esto se ilustra en el segundo gráfico siguiente con la superposición del DAX y el EUR (nótese que se trata del EUR, no del EURUSD ni de ningún otro par que contenga EUR).
El indicador calcula la tasa sintética entre dos índices bursátiles (especificada en los parámetros) y la compara con la tasa del símbolo del gráfico. Por ejemplo, en el caso de EURUSD se puede elegir DAX vs S&P500, o CAC40 vs Dow Jones para el análisis. De hecho, S&P500 representa S&P500/USD en términos de Forex, y DAX es el par DAX/EUR. Así, la relación de estos dos índices forma un tipo alternativo del EUR/USD. El indicador muestra este sintético como tal (el parámetroScalingPeriod se establece en 0, véase más abajo) o como valores normalizados respectivamente a la media móvil especificada(ScalingPeriod supera 0). Pero lo más importante es que estos valores normalizados de un símbolo estándar de Forex y su análisis sintético se muestran uno al lado del otro demostrando las fases de convergencia y divergencia.
El indicador funciona bien con estrategias como la negociación por pares y la cobertura: negocie el par de divisas (línea azul claro) en la dirección del análisis sintético (línea verde claro) y, opcionalmente, negocie índices en la dirección opuesta.
Si sólo se negocia el par Forex, su broker no tiene por qué tener índices en el modo de negociación permitido. Los índices serán suficientes.
Parámetros
- ReferenceSymbol1 - nombre del símbolo correspondiente a la segunda divisa (cotización) del símbolo; por ejemplo, S&P500 para EURUSD; sin valor por defecto;
- ReferenceSymbol2 - nombre del símbolo correspondiente a la primera divisa (base) del símbolo; por ejemplo, DAX para EURUSD; sin valor por defecto;
- Smoothing - periodo de media móvil aplicado sobre la curva sintética para el suavizado (por defecto - 5);
- ScalingPeriod - periodo de media móvil para la normalización relativa, el valor por defecto es 21;
- ScalingMethod - modo de media móvil para la normalización relativa, el valor por defecto es MODE_EMA;
- ScalingPrice - precio medio móvil para la normalización relativa, el valor por defecto es PRICE_CLOSE;
- Threshold - diferencia entre dos índices como divergencia necesaria para generar una señal de negociación; el valor por defecto es 0, no hay señales; si su valor es superior a 0, el indicador muestra etiquetas azules (compra) y rojas (venta) en las barras en las que la distancia supera el umbral.
Si no se especifican índices, el indicador muestra alertas de ayuda para las principales divisas de Forex.
Los tickers de los índices de mercado especificados en ReferenceSymbol1 y ReferenceSymbol2 deben estar disponibles en Market Watch. El indicador funciona únicamente con las cotizaciones estándar de su broker y no solicita ningún servicio externo.
Ejemplos de configuración para las principales divisas
EURUSD
- ReferenceSymbol1 - S&P500, o Dow Jones, o Nasdaq100;
- ReferenceSymbol2 - DAX, o CAC40;
GBPUSD
- ReferenceSymbol1 - S&P500, o Dow Jones, o Nasdaq100;
- ReferenceSymbol2 - FTSE;
USDJPY
- ReferenceSymbol1 - Nikkei;
- ReferenceSymbol2 - S&P500, o Dow Jones, o Nasdaq100;
Plazos preferidos: H1 o superior. Aunque el indicador sincroniza las barras de sus símbolos de trabajo y de referencia, asegúrese de que no hay agujeros en su historial.