SyntheticIndex
- インディケータ
-
Stanislav Korotky
 Trading is just my hobby. I'm working in IT industry. So developement of experts, indicators, and script is not a problem at all to me. Wide range of technologies are used: MQL4, MQL5, system and applied programming, web-services, neural networks and more.
New: - バージョン: 1.2
- アップデート済み: 18 7月 2018
- アクティベーション: 5
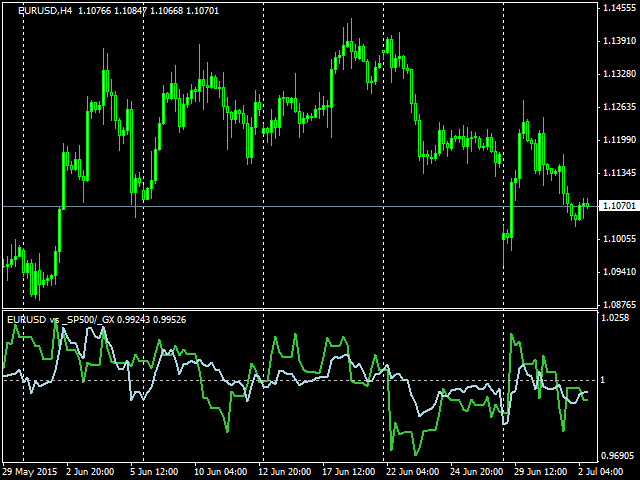
The indicator compares quotes of the current symbol and a synthetic quote calculated from two specified referential symbols. The indicator is useful for checking Forex symbol behavior via corresponding stock indices and detecting their convergence/divergence which can forecast future price movements.
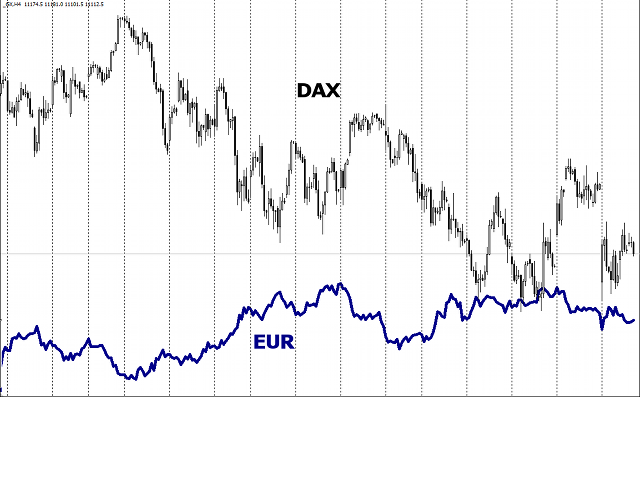
The main idea is that all stock indices are quoted in particular currencies and therefore demonstrate correlation with Forex pairs where these currencies are used. When market makers decide to "buy" one or another stock index, they sell currency the index is quoted in. For example the S&P500 upward trend is usually confirmed by the USD downward trend. And likewise, USD usually grows when S&P500 and other American indices fall (people may be said to go into cash). This is illustrated in the second chart below with DAX and EUR superposition (note that this is EUR, not EURUSD or any other pair which contains EUR).
The indicator calculates synthetic rate between two stock indices (specified in parameters) and compares it with the chart symbol rate. For example, in case of EURUSD one can choose DAX vs S&P500, or CAC40 vs Dow Jones for analysis. In point of fact, S&P500 represents S&P500/USD in Forex terms, an DAX is the DAX/EUR pair. Thus, ratio of these two indices forms an alternative rate of EUR/USD. The indicator shows this synthetic as such (the ScalingPeriod parameter is set to 0, see below) or as values normalized respectively to the specified moving average (ScalingPeriod exceeds 0). But the most important thing is that these normalized values of a standard Forex symbol and its synthetic analysis are displayed side by side demonstrating convergence and divergence phases.
The indicator works well with such strategies as pairs trading and hedging: trade the Forex pair (light-blue line) in the direction of the synthetic (light-green line) and optionally trade indices in the opposite direction.
If only Forex pair is traded, your broker does not have to have indices in the allowed trading mode. Indicatives will be enough.
Parameters
- ReferenceSymbol1 - name of the symbol corresponding to the second currency (quotation) of the symbol; for example, S&P500 for EURUSD; no default value;
- ReferenceSymbol2 - name of the symbol corresponding to the first currency (base) of the symbol; for example, DAX for EURUSD; no default value;
- Smoothing - a period of moving average applied on the synthetic curve for smoothing (default - 5);
- ScalingPeriod - moving average period for relative normalization, default value is 21;
- ScalingMethod - moving average mode for relative normalization, default value is MODE_EMA;
- ScalingPrice - moving average price for relative normalization, default value is PRICE_CLOSE;
- Threshold - difference between two rates as divergence necessary for generating a trading signal; default value is 0, no signals; if its value exceeds 0, the indicator displays blue (buy) and red (sell) labels on bars where the distance exceeds the threshold.
If indices are not specified, the indicator displays helping alerts for major Forex currencies.
Tickers for market indices specified in ReferenceSymbol1 and ReferenceSymbol2 must be available in Market Watch. The indicator works solely with standard quotes from your broker and does not request any external services.
Examples of Settings for Major Currencies
EURUSD
- ReferenceSymbol1 - S&P500, or Dow Jones, or Nasdaq100;
- ReferenceSymbol2 - DAX, or CAC40;
GBPUSD
- ReferenceSymbol1 - S&P500, or Dow Jones, or Nasdaq100;
- ReferenceSymbol2 - FTSE;
USDJPY
- ReferenceSymbol1 - Nikkei;
- ReferenceSymbol2 - S&P500, or Dow Jones, or Nasdaq100;
Preferred timeframes: H1 or higher. Although the indicator synchronizes bars of your working and referential symbols, make sure that there are no holes in their history.