Robots comerciales e indicadores para MetaTrader 5 - 167
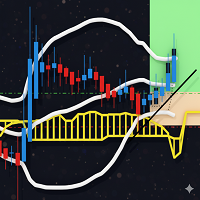
Idea general de la estrategia Esta estrategia se basa en una lógica simple pero muy eficaz: operar los impulsos del mercado en la dirección de la tendencia principal, combinando el poder de la Nube de Ichimoku y las Bandas de Bollinger. El robot no intenta captar todos los movimientos del precio, sino que se centra en las rupturas significativas, cuando la volatilidad explota y la tendencia dominante se establece claramente. Lógica de funcionamiento El sistema se basa en dos pilares técnicos cl

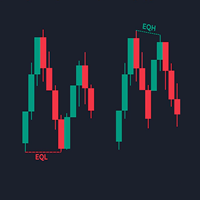
ICT Conceptos de Dinero Inteligente Profesional v3 . 00 La solución de trading ICT definitiva Transforme su trading con el indicador Inner Circle Trader más avanzado en MQL5 ! Herramienta de nivel profesional que implementa la auténtica metodología ICT con una estabilidad a prueba de balas . ¿Por qué elegir este indicador ICT? Implementación profesional Cero errores de validación : pasa todas las pruebas de MetaTrader a la perfección Manejo de datos mejorado - Funciona con datos limit
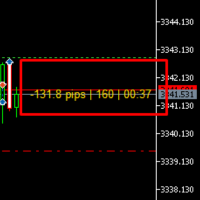
Ultimate Trading Companion Indicador para MT5
¡Hola!
Este indicador inteligente y fácil de usar está diseñado para darle una clara ventaja en el mercado. Muestra: Pips en Vivo de Operaciones Abiertas - Vea instantáneamente cuánto está ganando o perdiendo en pips. Temporizador de cuenta atrás de velas - Sepa exactamente cuándo se cerrará la vela actual. Visualización de spreads en tiempo real - Manténgase al tanto de las condiciones del mercado y evite malas entradas. Colores totalmente personal

ZenSniper Pro: Un Enfoque Disciplinado para el Trading Precios de Lanzamiento Progresivos Para honrar a nuestros primeros usuarios y construir una comunidad sólida en torno a la visión a largo plazo de ZenSniper Pro, estamos implementando un modelo de precios progresivo. El precio está configurado para aumentar a medida que el producto gane más usuarios y reciba futuras actualizaciones. Primeras 20 Activaciones: $30 Activaciones 21 a 70: $125 Precio Final (a partir de la activación 71): $599 ¿Es

Indicador de continuación de tendencia y grandioso para reversión
Creado especialmente para el par xauusd en el marco de tiempo m1
Ema 10 y Ema 30 verde significa tendencia alcista y sólo considera flechas verdes
Ema 10 y Ema 30 rojo significa tendencia bajista y sólo considera flechas rojas
Indicador creado para generar dinero, consistente y fácilmente
Sea disciplinado.

Quantum Quokka proporciona ejecuciones de operaciones inteligentes con precisión y rapidez. Tiene una impresionante tasa de éxito del 90 % y puede convertir $500 en $20,000 con estrategias optimizadas. Características clave: Quantum Quokka utiliza trading impulsado por IA, incorporando aprendizaje automático para predecir tendencias del mercado y optimizar estrategias de operación. Supervisa continuamente los movimientos de precios y ejecuta operaciones al instante, asegurando que los traders no

Reversal Arrow Pro — Precise Buy/Sell Reversal Signal Indicator
Reversal Arrow Pro is a leading indicator designed to detect the early stages of high-probability market reversals. Unlike traditional tools that react after a trend has formed, this indicator aims to anticipate turning points using a proprietary formula based on advanced momentum analysis. What is a Leading Indicator?
Most popular indicators, such as Moving Averages, MACD, and Stochastic Oscillators, are considered lagging i
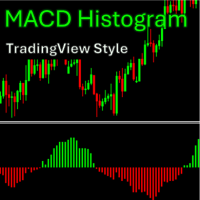
Indicador MACD Avanzado para MetaTrader 5 , diseñado para parecerse y comportarse como en TradingView, con una claridad de momentum aún mejor y respuesta en tiempo real del precio. Características: Cálculos precisos del MACD y de la línea de señal Visualización solo como histograma – sin líneas que distraigan Colores dinámicos: verde = por encima de cero, rojo = por debajo de cero Compatible con todos los marcos de tiempo y activos (incluido NAS100) Perfecto para: Traders que están camb
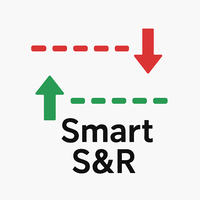
Este indicador personalizado de soporte y resistencia con flechas de señal está diseñado para MetaTrader 5 (MT5) para ayudar a los operadores a identificar zonas de precios clave y posibles puntos de reversión en el mercado. Combina la detección clásica de soporte y resistencia con la generación inteligente de señales para tomar mejores decisiones de trading. Características principales: Detección automática de soportes y resistencias:
El indicador escanea los datos históricos de precios dentro
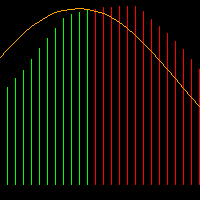
El MACD de Impulso es un indicador técnico que combina el poder de múltiples medias móviles para crear un oscilador de impulso único. A diferencia de los indicadores MACD tradicionales, esta herramienta utiliza tres medias móviles diferentes aplicadas a datos de precios altos, bajos y ponderados para generar señales de impulso de mercado más precisas. Su punto fuerte es su excelente capacidad de filtrado durante los mercados oscilantes. Elementos visuales Histograma codificado por colores : Barr

INFORMACIÓN IMPORTANTE ANTES DE LA COMPRA ESTE EA DEPENDE DE LA INTEGRACIÓN LIVE AI A TRAVÉS DE CLAVES API . LA CORRECTA INTEGRACIÓN AI SE ENTREGA 7 DÍAS DESPUÉS DE LA COMPRA DEBIDO A SU COMPLEJIDAD ESTE EA ES DE CANTIDAD LIMITADA Y FUNCIONA POR ORDEN DE LLEGADA ArcaneX - Asesor experto de grado cuántico para la ejecución del mercado en tiempo real Introducción ArcaneX es un Asesor Experto de nueva generación diseñado para operadores avanzados e instituciones que buscan un sistema

INFORMACIÓN IMPORTANTE ANTES DE LA COMPRA Lo mejor de lo mejor ESTE EA DEPENDE DE LA INTEGRACIÓN DE AI EN VIVO A TRAVÉS DE CLAVES API LA CORRECTA INTEGRACIÓN AI SE ENTREGA 7 DÍAS DESPUÉS DE LA COMPRA DEBIDO A SU COMPLEJIDAD ESTE EA ES DE CANTIDAD LIMITADA Y FUNCIONA POR ORDEN DE LLEGADA NANO EDGE - Asesor experto de múltiples capas impulsado por IA para una ejecución avanzada del mercado Introducción Nano Edge es un Asesor Experto (EA) de nivel institucional diseñado para operador

[AVISO IMPORTANTE - LEER PRIMERO] ESTE EA DEPENDE DE LA INTEGRACIÓN LIVE AI A TRAVÉS DE CLAVES API LA CORRECTA INTEGRACIÓN AI SE ENTREGA 7 DÍAS DESPUÉS DE LA COMPRA DEBIDO A SU COMPLEJIDAD ESTE EA ES LIMITADO EN CANTIDAD Y FUNCIONA POR ORDEN DE LLEGADA VOLTA SPIKE Introducción VOLTA SPIKE es un Asesor Experto de nueva generación diseñado para operadores algorítmicos experimentados que buscan un sistema capaz de adaptarse a entornos de negociación altamente volátiles y

Obtenga un gráfico limpio en un instante. Este script es extremadamente útil para eliminar no sólo todos los objetos gráficos del gráfico , sino también todos los indicadores del gráfico.
Obtenga la versión MT4 aquí . Características:
Diálogo de Confirmación : Pide confirmación antes de limpiar el gráfico.
Limpieza completa : Elimina todos los objetos gráficos (líneas, flechas, formas, etc.) Elimina todos los indicadores de todas las ventanas del gráfico (principal y subventanas) Registro : I
XSmartPro EA - Sistema Profesional de Trading de Cuadrícula Grid Bidireccional Inteligente DCA con Filtros de Seguridad Avanzados Visión general XSmartPro EA es un sistema profesional de trading Grid DCA (Dollar Cost Averaging) diseñado para traders que quieren operar en Forex de forma segura y eficiente. El EA utiliza una estrategia inteligente de cuadrícula bidireccional combinada con filtros técnicos avanzados para optimizar los puntos de entrada y proteger su cuenta. Características principa
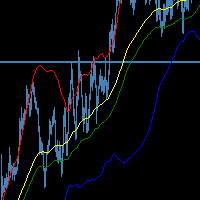
El indicador de bandas SMMA es una herramienta avanzada de negociación basada en la volatilidad que crea 6 niveles dinámicos de soporte y resistencia en torno a una envolvente formada por dos medias móviles suavizadas (SMMA). Este indicador combina la fiabilidad de la identificación de tendencias SMMA con la precisión de las bandas de volatilidad basadas en la desviación estándar, por lo que es adecuado tanto para estrategias de seguimiento de tendencias como de reversión de medias.
Cada banda

El EURUSD institucional - Opere con precisión Aproveche el poder de las estrategias de negociación institucionales con "The Institutional EURUSD", un asesor experto meticulosamente diseñado para navegar por el par de divisas más negociado del mundo. No se trata de otro sistema de cuadrícula o martingala; es un sofisticado robot que identifica y actúa sobre los mismos conceptos de acción de precios de alta probabilidad que utilizan los operadores profesionales y las instituciones. Optimizado espe

¡Disponible gratis por tiempo limitado! ¿Le gusta? Avalie para ayudarnos a mejorar :)
Fortuno es un robot de comercio para MetaTrader 5, diseñado para operar estratégicamente con base en el indicador RSI (Índice de Fuerza Relativa). Ideal para traders que buscan operaciones precisas y disciplinadas con una lógica clara de entrada y salida, Fortuno ofrece un rendimiento automatizado en gráficos de 5 minutos, centrado en periodos de sobrecompra y sobreventa.
Principales características:
Zlatanic Pro – Módulo de Señales Inteligentes con IA para EAs Profesionales
Lleva tu Asesor Experto al siguiente nivel con Zlatanic Pro , un motor de señales avanzado impulsado por inteligencia artificial, diseñado para traders que exigen precisión, rendimiento y control total. Gracias a algoritmos de IA de última generación, Zlatanic Pro analiza el mercado en tiempo real utilizando un modelo lógico propietario, generando señales de alta probabilidad sin revelar los secretos de tu estrategia.

OP Skill FX Joker - Estrategia Anual con IA y Lógica Matemática
Telegram para acceder a la configuración SET.
Descripción: Descubre una nueva forma de operar en los mercados, donde la Inteligencia Artificial y la precisión matemática se unen para tomar decisiones lógicas y estratégicas. OP Skill FX Joker ha sido desarrollado para analizar el mercado en profundidad, identificando oportunidades de alta probabilidad. Olvídese de los enfoques de alto riesgo. La filosofía del OP Skill FX Joker es e
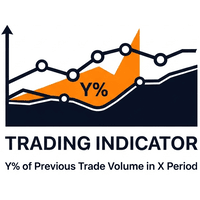
Este indicador calcula y visualiza el rango de precios que contiene el 70% superior (configurable) del volumen negociado para el marco temporal anterior seleccionado, utilizando un enfoque de binning flexible. Esto permite al operador ver claramente entre qué rango de precios se negoció la mayor parte del volumen, lo que se alinea muy bien también con los niveles de soporte y resistencia, haciendo posible tanto la negociación intradía entre máximos y mínimos como detectar zonas de ruptura, espec
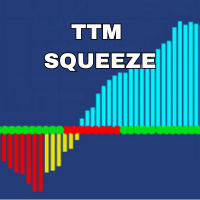
Descripción del Indicador TTM Squeeze Momentum Pro La introducción de TTM Squeeze Momentum Pro - un potente, todo-en-uno la volatilidad y el impulso de ruptura del sistema diseñado para los comerciantes serios que quieren configuraciones de alta probabilidad de comercio durante las fases de compresión y expansión del mercado. Este indicador patentado combina el concepto probado TTM Squeeze con un motor de impulso ponderado por inercia , proporcionando una confirmación visual mejorada para el mom
Asesor Experto de compensación MT5 con niveles ZigZag y Fibonacci incorporados que no se repiten. Opera en la ruptura de un nivel de Fibonacci seleccionable en la dirección del movimiento del mercado, después de un segmento A-B contra-tendencia. Puede promediar una posición perdedora en un rebote de Fibonacci seleccionable. Incluye la funcionalidad de cierre parcial. Las nuevas posiciones se abren sólo si el precio de mercado está dentro de un rango Fibonacci especificado. Muy importante: su cu

Conoce a Pearl – El Asistente Inteligente de Trading de FXGoldTraders
Pearl no es solo un Asesor Experto: es tu socia estratégica en trading, diseñada con precisión por Forex Prince y co‑desarrollada bajo la marca FXGoldTraders. Inspirada por el estilo y la fortaleza de una trader femenina experta en tendencias, Pearl es el primer EA de su tipo en nuestra línea, representando innovación e intuición en el mercado. Creada para MetaTrader 4 y 5, Pearl se especializa en operar Oro, pares de divisas

AVISO IMPORTANTE: Illuminati Gold EA está desarrollado exclusivamente para GOLD (XAUUSD) 1 Min, 5 min timeframe. No lo utilice en cualquier otro par de comercio. Los resultados pueden no ser óptimos.
Saludos, Traders, Presentamos Illuminati Gold EA - el último y más inteligente avance en la Familia Quantum de Asesores Expertos. Diseñado específicamente para XAUUSD , este asesor experto ofrece una precisión y rendimiento sin igual en el mercado del oro. Diseñado con claridad estratégica y algo

Cómo funciona el indicador MultiMarket Direction es un indicador potente y versátil para la plataforma MetaTrader, diseñado para ayudar a los operadores a visualizar las tendencias del mercado e identificar posibles puntos de entrada. Mediante la combinación de herramientas de análisis técnico de eficacia probada, como las medias móviles exponenciales (EMA) y los niveles máximos y mínimos, este indicador proporciona una visión clara y completa de la dinámica del mercado. El indicador muestra lo

Supertrend AI (Clustering) – With Signals es un indicador de seguimiento de tendencia de nueva generación, diseñado para ofrecer precisión en la operativa con Forex, criptomonedas e índices. Utiliza múltiples configuraciones de Supertrend agrupadas dinámicamente según el rendimiento en tiempo real para identificar el mejor multiplicador de ATR en cada condición de mercado. Características: Selección de multiplicador ATR por clustering Señales de compra/venta sin repintado Supertrend alcista y ba

Este indicador MQL5 monitoriza automáticamente todos los objetos dibujados en el gráfico y envía notificaciones push cuando el precio los toca. Los objetos soportados incluyen líneas horizontales, líneas de tendencia, rectángulos, triángulos, elipses y canales. Cada tipo de objeto puede activarse o desactivarse individualmente. El indicador ofrece varias opciones de alerta (push, popup, sonido) y cuenta con un sistema de enfriamiento para evitar el spam. Es perfecto para los operadores que desea
Desbloquee poderosas perspectivas de negociación con el Indicador de Cruce del Cuadro de Mando , una herramienta dinámica diseñada para operadores de divisas serios. Este tablero inteligente trae señales de cruce en tiempo real de múltiples indicadores , a través de múltiples pares de divisas , y en múltiples marcos de tiempo, todo en un panel compacto y fácil de leer. Características principales: Soporte Multi-Tiempo : Busque al instante señales de cruces (por ejemplo, medias móviles, MACD, est

Advanced Market Structure Pro - Indicador de Análisis de Tendencias Multi-Timeframe Visión general Advanced Market Structure Pro es un sofisticado indicador de análisis técnico que combina la tecnología Zero Lag EMA (ZLEMA) con bandas de volatilidad adaptativas para identificar cambios de tendencia de alta probabilidad y señales de continuación en múltiples marcos temporales. Este indicador proporciona a los operadores un completo sistema de análisis de la estructura del mercado adecuado para to
Indicador de línea de tendencia MNK Este indicador construye una línea de tendencia lineal basada en el método de los mínimos cuadrados (MCO). Le ayuda a detectar la tendencia principal del precio para cualquier símbolo o marco temporal. Periodo personalizable Muestra la fuerza de la tendencia Puede utilizarse en asesores expertos (a través de iCustom) Funciona en cualquier instrumento y marco temporal. Un indicador de Media Móvil de Mínimos Cuadrados (LSMA), también conocido como Media Móvil de
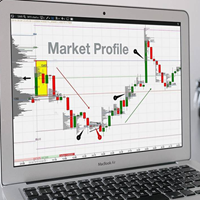
Indicadores de perfil de volumen: conceptos básicos Definición Un perfil de volumen es un indicador de análisis técnico avanzado que muestra la actividad de negociación durante un periodo de tiempo específico en determinados niveles de precios. Teniendo en cuenta parámetros del usuario como el número de filas y el periodo de tiempo, el indicador construye un histograma en el gráfico que refleja los niveles de precios dominantes o significativos en función del volumen. Esencialmente, el perfil de

HK50 Estrategia a corto plazo (2025.03-2025.06)
Se trata de un EA de negociación grid de nivel empresarial diseñado específicamente para el índice Hang Seng (HK50), que admite la negociación automatizada multiperiodo. El EA adopta un diseño de parámetros muy simplificado, sólo es necesario establecer el tamaño de lote básico, y todos los parámetros principales están incorporados como valores predeterminados robustos, adecuados para una rápida implementación por parte de instituciones y usuario

Hola traders, he diseñado esta herramienta con resultados reales rigurosamente. Basada en varias de mis estrategias anteriores, la adapté al mercado Forex de metales XAUUSD GOLD. Por lo tanto, está adaptada a la inteligencia artificial del aprendizaje automático. Es decir, la IA leerá los parámetros y los consultará con mi estrategia, aprendiendo así a mejorar la calidad de las entradas. Además, cuenta con un nodo para recuperar posiciones. Otra innovación es que todo estará encapsulado virtual

TMA Currency Meter es el medidor de divisas definitivo. Basado en la Media Móvil Triangular de todos los símbolos disponibles, este indicador muestra qué divisas están fuertes, fortaleciéndose, débiles o debilitándose. Tanto los operadores experimentados como los novatos verán las divisas fuertes y débiles en un abrir y cerrar de ojos, y sabrán qué posibilidades comerciales explorar más a fondo. TMA Currency Meter es un verdadero indicador Multi Timeframe. Es fácil mostrar las fortalezas de las
PythonX - EURUSD M1 Asesor Experto de Ruptura Híbrido Una operación a la vez. Baja reducción. Diseñado para firmas de fondeo y traders minoristas. Probado en EURUSD M1 usando datos de ticks reales (2015–2025 o los más recientes disponibles) con más de 25 brokers y firmas de fondeo.
Diseñado para ofrecer precisión, consistencia y reducción ultra baja — incluso en cuentas de $100. Todas las pruebas se realizaron con un balance de $100, apalancamiento 1:1000 y SL/TP fijos.
Capturas de pantalla adj

ProTrader Auto Layer Smart Risk EA MT5 Automated Trading | Estrategia Smart Grid | Control de Riesgo Profesional Auto Layer . Control de Riesgo Inteligente . Automatización de élite para operadores serios. IMPORTANTE: Este EA se desarrolla en condiciones de mercado reales , lo que significa que los resultados de las operaciones reales pueden diferir de las pruebas retrospectivas. Si utiliza el probador de estrategias , por favor DM para obtener instrucciones detalladas. Promoción de lanzamiento

ESCRÍBAME PARA CONFIGURAR EL ROBOT SEGÚN SU CAPITAL
El GBPUSD Institucional - Opere con Lógica Institucional Descripción: Presentamos The Institutional GBPUSD, un Asesor Experto especializado que aplica "Conceptos de Dinero Inteligente" para navegar por el mercado GBPUSD con precisión de grado institucional. Este EA no es un robot más; es una sofisticada herramienta de trading diseñada para identificar zonas de alta probabilidad donde los principales actores del mercado realizan sus movimient
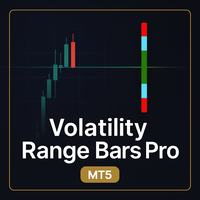
Volatilidad Rango Barras Pro(MT5) Visualice la Volatilidad. Afine sus entradas. Opere con confianza. Volatility Range Bars Pro es un potente indicador de MetaTrader 5 diseñado para los operadores que quieren claridad instantánea sobre la volatilidad del mercado y el posicionamiento basado en pips. Si usted está scalping o día de negociación, esta herramienta le da una visual "regla de la volatilidad" que le ayuda a: Medir instantáneamente la volatilidad actual del mercado Estimar las distancias
### **Guía del Usuario para la Instalación y Uso del Indicador CVD en MT5** **Nombre del Indicador:** Delta de Volumen Acumulado (CVD) **Versión:** 1.00 **Propósito:** Visualiza el balance de presión de compra/venta a través del análisis de volumen.
---
### **Instalación** 1. Descarga el archivo `CVD.mq5`. 2. En MT5: - `Archivo` → `Abrir carpeta de datos`. - Navegue hasta `MQL5/Indicators`. - Pega el archivo en la carpeta. 3. Reinicie MT5. 4. En el panel "Navegador": - Haga clic con el bot

En el vertiginoso mundo del comercio de criptomonedas, comprender la dinámica del mercado es crucial para tomar decisiones informadas. Uno de los indicadores clave que los operadores utilizan para analizar el comportamiento del mercado es el Volumen Delta, que ofrece información sobre el equilibrio entre la presión de compra y de venta. Este artículo explora el concepto de Delta de Volumen, su importancia en el análisis del flujo de órdenes y cómo puede utilizarse eficazmente en las estrategias

Quantelia - Asesor Experto de Trading para XAUUSD Quantelia es un asesor experto en trading automatizado diseñado específicamente para operar con el instrumento XAUUSD (oro). Su principal objetivo es reducir la carga de trabajo del trader y ayudarle a tomar decisiones de trading bien equilibradas dentro de una estrategia definida.
Características principales Desarrollado desde cero basado en la experiencia real de trading Utiliza una estrategia de cuadrícula con lógica de entrada adaptable y g

**Prop Dominus** - Asesor Experto Avanzado basado en Inteligencia Artificial para MetaTrader 5
---
## **I. Resumen Ejecutivo**
Prop Dominus es un Asesor Experto (EA) de múltiples capas, mejorado con IA, diseñado para la plataforma MetaTrader 5. Sus fundamentos se basan en el modelado probabilístico, los sistemas de inferencia dinámica y la inteligencia artificial. Sus fundamentos se basan en el modelado probabilístico, los sistemas de inferencia dinámica y el reconocimiento avanzado del rég

Divine Duality MT5 — Sistema de Trading Automatizado Divine Duality MT5 es un Asesor Experto para MetaTrader 5, basado en algoritmos de análisis de mercado y estrategias de gestión de riesgos. Funciona de manera totalmente automática y requiere mínima intervención del trader. ¡Atención! Contáctame inmediatamente después de la compra para recibir las instrucciones de configuración. Por qué elegir Divine Duality MT5 Algoritmos de análisis: trading automatizado basado en modelos internos de análisi

HumaI Power Zones – Mapeo OHLC Preciso para Traders Serios Descripción
HumaI Power Zones es un indicador diseñado con precisión para identificar y trazar los niveles OHLC (Apertura, Máximo, Mínimo, Cierre) más relevantes en los marcos temporales Diario (D1), Semanal (W1), Mensual (MN1) y Anual (Y1) . Estos niveles se calculan con exactitud y se dibujan en tiempo real, proporcionando una vista precisa de la estructura histórica que permanece estable y confiable en cualquier gráfico. Ya sea qu

resultado en vivo:
OFERTA POR TIEMPO LIMITADO: ¡Obtén la mejor oferta antes de que suban los precios! Precio final: 990$ Conoce al Cambiador de Juego: Fresh Forge Imagina un EA que hace más que solo realizar operaciones; gestiona estratégicamente cada orden para un mejor control del riesgo. Fresh Forge está diseñado para destacar en mercados volátiles, adaptándose rápidamente a los movimientos de precios. Presenta un enfoque único donde divide cada posición en múltiples órdenes más pequeñas, c

ATENCIÓN: Flash Fund X está optimizado exclusivamente para entornos de mercado real. Debido a su avanzada API y a su arquitectura basada en IA, es posible que las pruebas retrospectivas no reflejen con exactitud el comportamiento real de las operaciones en tiempo real. La ejecución de datos en tiempo real es esencial para un rendimiento óptimo. Presentación de Flash Fund X : un motor de ejecución de nueva generación para la dinámica de los mercados modernos En un mercado gobernado por la fragmen

PRECAUCIÓN: Wave Seeker sólo funciona de forma óptima con datos de mercado en tiempo real. Debido a su avanzada integración con API en tiempo real y a su lógica basada en IA, es posible que las pruebas de estrategia tradicionales no representen con exactitud su funcionalidad o sus resultados en el mundo real. Presentación de Wave Seeker : la cúspide del conocimiento inteligente del mercado Entre en una nueva frontera de innovación en el trading con Wave Seeker , un innovador asesor experto diseñ
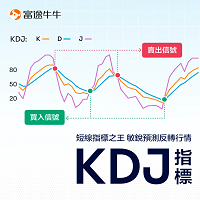
El indicador KDJ es un indicador de oscilación de momento muy útil compuesto por tres líneas indicadoras K, D, J. Muchas personas también se refieren al indicador KDJ como un "indicador aleatorio" porque en realidad añade una línea J como auxiliar sobre la base de un indicador aleatorio tradicional (que sólo contiene líneas K, D). El indicador KDJ tiene un cierto grado de exhaustividad, ya que aprovecha las ventajas del indicador William (WMSR) y de las medias móviles (MA) para ayudar a los inv
Órdenes de Mercado o Pendientes, Compra Límite, Venta Límite
Con esta versión para MetaTrader 5, el usuario puede realizar las mismas funciones que en MetaTrader 4. Con esta orden, puede enviar órdenes de mercado o pendientes con Stop y Take definidos (configurables por el usuario), lo que agiliza las entradas y evita la pérdida de la señal de entrada. La confirmación de las órdenes se realiza al tercer clic para evitar conflictos al eliminar objetos del gráfico.
Local Trade Copier es una herramienta avanzada diseñada para copiar eficazmente operaciones entre cuentas en modo local . Permite replicar órdenes a la velocidad del rayo desde una cuenta maestra a una cuenta esclava. En modo local, las operaciones se copian instantáneamente, mientras que en modo remoto, el proceso de copia tarda menos de 1 segundo. Versión MT4 MT5 Versión Completa (Local y Remota) MT4 Versión Completa (Local y Remoto) El modo local se refiere a ambas plataformas MetaTrader ins

MARKET SURGE DYNAMO - Sistema profesional de trading multi-marco de tiempo. ¡Transforma tu trading con el poder de la automatización inteligente! ¿Por qué elegir MARKET SURGE DYNAMO? MARKET SURGE DYNAMO es un asesor experto sofisticado pero fácil de usar diseñado para capturar oportunidades de mercado a través de múltiples pares de divisas y marcos de tiempo. Si usted es un operador experimentado o acaba de empezar su viaje de divisas, este EA ofrece un rendimiento constante con caracterís

Layer Grid Expert Advisor - Descripción completa del producto
SECCIÓN 1: Visión general ejecutiva Un sistema basado en la estructura, la inteligencia y la adaptabilidad Layer Grid es un Asesor Experto de última generación diseñado para operadores que exigen algo más que automatización: buscan sistemas arraigados en la estructura, refinados mediante la inteligencia y probados mediante la consistencia en el mundo real. A diferencia de los EA del mercado masivo construidos sobre plantillas rígidas

¿Está cansado de los asesores expertos que sólo funcionan bien en unas condiciones de mercado concretas? ¿Necesita una herramienta flexible y potente que pueda adaptar su estrategia a medida que el mercado cambia entre tendencias y consolidaciones? Le presentamos WaveMaster Hunter , un sistema de trading sofisticado y muy versátil diseñado para el trader serio. No se trata sólo de una estrategia, sino de dos modelos de negociación independientes integrados en un único asesor experto inteligente,
Opere como los bancos: Barrido de liquidez de grado institucional + Estrategia CHoCH Escríbeme en mensajes personales para obtener archivos .set
Acerca de este EA Este Asesor Experto totalmente automatizado implementa una estrategia de trading institucional probada que combina barridos de liquidez, CHoCH (Cambio de Carácter) y retrocesos de Fibonacci para capturar retrocesos de alta probabilidad durante las sesiones de Londres y Nueva York . Espera a que haya agarre de liquidez antes de entra

Visión general Alpha Sniper es un avanzado robot de trading basado en el Concepto de Dinero Inteligente (SMC) diseñado para operar con precisión utilizando la lógica institucional. Se centra en la identificación de las trampas de liquidez , las brechas de valor justo (FVGs) , y los bloques de órdenes (OBs) , y ejecuta las operaciones utilizando la acción del precio limpio . Diseñado para funcionar mejor en USDJPY,EURUSD, también soporta cualquier instrumento en MT5.
Descripción de Parámetros E
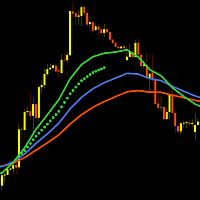
"Trend Acceleration 5" está diseñado para ayudar a los operadores a navegar por la situación del mercado. El indicador muestra tres "Medias Móviles" de múltiples marcos temporales, que muestran la tendencia del movimiento de los precios de los instrumentos financieros. Son la base para el análisis de las dependencias, que con gran éxito muestran la aceleración o desaceleración de la tendencia (tendencia) de los mercados financieros.
La elección de utilizar tres medias móviles en el indicador "T

Impulse su análisis técnico con nuestro Indicador de Líneas del Día de la Semana , una herramienta potente pero ligera diseñada para operadores que desean visualizar claramente la estructura diaria del mercado.
Características principales: Auto Dibuja Líneas Verticales para cada día de negociación: De lunes a viernes
Colores y estilos personalizables para adaptarse a su tema gráfico
Las etiquetas de día ( Lun, Mar, etc.) aparecen junto a las líneas para facilitar el seguimiento
Funciona

Rendimiento consistente probado - backtested de 2021 a 2025 con un crecimiento constante cada semana, mes y año.
ELTRA Guardian EA es un Asesor Experto totalmente automatizado optimizado exclusivamente para operar con XAU/USD (Oro) . Combina entradas precisas basadas en niveles con filtrado de tendencia EMA para ofrecer un rendimiento constante en los volátiles mercados de oro. Características principales: E strategia exclusiva para el oro: Específicamente diseñada y ajustada para el XAU/US

DanielSniper Pro - Asesor Experto de Trading Profesional Descripción del producto DanielSniper Pro es un Asesor Experto sofisticado y fiable optimizado específicamente para operar con el índice US30 (Dow Jones Industrial Average) . Desarrollado con algoritmos de última generación y probado exhaustivamente para 2025 condiciones de mercado, este EA representa el pináculo de la tecnología de trading automatizado diseñado para traders serios que buscan un rendimiento consistente. Por defecto no está

Toda la nueva interfaz y función Añadir telegrama notificar (usted tiene que conseguir Telegram bot API y chat ID). Con este ea, usted puede ganar 10-40% aún más beneficios / mes!
1. Este EA se utiliza para tomar automáticamente el beneficio o DCA sus órdenes en MT5 de acuerdo con los parámetros que establezca. Puede introducir la primera orden en su teléfono o terminal MT5 en su computadora y automáticamente tomar ganancias o DCA sus órdenes. 2. Introduzca el precio límite de compra/venta * Bu

¿Qué es WJ ZonePilot EA? WJ ZonePilot EA es un Asesor Experto MT5 semiautomático y avanzado que permite a los operadores definir zonas de precios personalizadas (Oferta y Demanda/Soporte y Resistencia) en el gráfico y gestionar automáticamente las operaciones basándose en una lógica inteligente de entrada, salida y riesgo. Está diseñado para operadores discrecionales y automatizados que desean operar con precisión y control , sin tener que cuidar el gráfico, simplemente coloque sus zonas y de
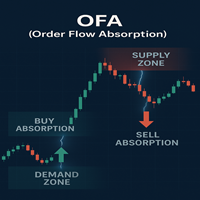
Absorción del flujo de órdenes (OFA) - Huella inteligente y panel de volumen Descubra la verdadera intención del mercado.
El indicador Order Flow Absorption (OFA) le ofrece una visión institucional de la dinámica del mercado, destacando las zonas agresivas de compra/venta y los desequilibrios de la huella, con un panel limpio y personalizable. Características principales Panel de huella de comprador/vendedor
El panel conmutable en tiempo real muestra el flujo de volumen actual, anterior y tota

El asistente B5 y B3 es un indicador desarrollado para añadir un poco de certeza.
El indicador proporciona al operador entradas "predictivas" claras.
Cada entrada está marcada en el gráfico, con un valor en puntos y una cantidad estimada de picos.
CÓMO UTILIZAR EL INFDICADOR:
Cárguelo en su gráfico Boom 500 o B300.
Espere la señal.
Utilice la información de la señal para colocar SL y TP.
EJEMPLO DE CÓMO REALIZAR OPERACIONES:
Recibirá una alerta en el gráfico y una notificación push que s

MagicCrossOverEA - Trading de Tendencia más Inteligente con Potente Control MagicCrossOverEA es un sistema de trading totalmente automatizado basado en la estrategia de cruce de 2 medias móviles , reimaginada con modernas funciones inteligentes para los mercados actuales. Diseñado para los operadores que exigen tanto precisión como flexibilidad , este EA detecta de forma inteligente los cambios de tendencia, confirma las entradas utilizando filtros de plazos superiores y mejora la precisión con

¿Qué hay detrás de la inteligencia de SaToEA? Hemos integrado un motor de análisis de múltiples capas para garantizar que cada decisión se tome con la mayor precisión y seguridad posibles. Análisis inteligente de tendencias SaToEA no opera al azar. Primero identifica la corriente principal del mercado, asegurándose de que opera en la dirección de la tendencia dominante. Este enfoque aumenta la probabilidad de éxito y mitiga los riesgos de una contra-tendencia peligrosa, dándole tranquilidad m

EA MACHIAVELLI PRO - El maestro de las tendencias estratégicas . MACIAVELLI PRO LIBERA EL PODER DEL TRADING ESTRATÉGICO Transforma tu juego de trading con el EA MACHIAVELLI PRO - un Asesor Experto sofisticado pero fácil de usar para principiantes ¡que combina la astucia de la mente estratégica de Maquiavelo con el análisis de tendencias de vanguardia! ¿POR QUÉ ELEGIR MACHIAVELLI PRO? ESTRATEGIA INTELIGENTE DE TENDENCIAS - Detección avanzada de tendencias : identifica opor

Este EA está construido específicamente para el comercio XAUUSD con precisión y confianza. Se asegura de que las operaciones se introducen con la más alta probabilidad y tiene herramientas de gestión de riesgo impresionante en su lugar. Pruébelo, es único en el mercado. Para el 1 minuto XAUUSD preconfigurado para 1 minuto. Por favor, envíeme un mensaje para cualquier ayuda. Recomendaciones y requisitos; Par de divisas: XAUUSD Marco de tiempo: M1 o M5 Depósito mínimo: $50
Depósito inicial recomen

Como ya se adelantó en mi perfil, aquí está mi Expert Advisor Stock v3.
Quienes ya me conocen saben que no comparto la idea de mezclar la inteligencia artificial con el mundo del trading, ¡pues el ojo humano es capaz de reconocer patrones como nadie más—de lo contrario no existirían los CAPTCHA!
Soy un apasionado de la programación y finalmente he decidido embarcarme en esta aventura programando mi primer Expert Advisor.
Esta estrategia busca (por supuesto) detectar posibles posiciones abiertas

Versión MT4: https://www.mql5.com/en/market/product/139325
Versión MT5: https://www.mql5.com/en/market/product/139326
RONIN EA – Trading de Precisión en una Sola Operación
RONIN es un Asesor Experto disciplinado y potente, diseñado para traders que valoran la precisión, el control y la eficiencia. Inspirado en el espíritu del samurái solitario, RONIN ejecuta operaciones de entrada única utilizando una inteligente combinación de Potencia del Toro, Potencia del Oso y el indicador Alligator. Es
El Mercado MetaTrader es la única tienda donde se puede descargar la versión demo de un robot comercial y ponerla a prueba, e incluso optimizarla según los datos históricos.
Lea la descripción y los comentarios de los compradores sobre el producto que le interese, descárguelo directamente al terminal y compruebe cómo testar el robot comercial antes de la compra. Sólo con nosotros podrá hacerse una idea sobre el programa, sin pagar por ello.
Está perdiendo oportunidades comerciales:
- Aplicaciones de trading gratuitas
- 8 000+ señales para copiar
- Noticias económicas para analizar los mercados financieros
Registro
Entrada
Si no tiene cuenta de usuario, regístrese
Para iniciar sesión y usar el sitio web MQL5.com es necesario permitir el uso de Сookies.
Por favor, active este ajuste en su navegador, de lo contrario, no podrá iniciar sesión.