Conheça o Mercado MQL5 no YouTube, assista aos vídeos tutoriais
Como comprar um robô de negociação ou indicador?
Execute seu EA na
hospedagem virtual
hospedagem virtual
Teste indicadores/robôs de negociação antes de comprá-los
Quer ganhar dinheiro no Mercado?
Como apresentar um produto para o consumidor final?
Indicadores Técnicos para MetaTrader 4 - 30

This semaphore indicator is based in the standard RSI, which is applied over the Envelopes indicator that shows an envelope or envelope fluctuation borders. This is a version of RSI vs Envelopes drawn in the symbol window . A sell signal emerges when the upper envelope/border is broken by the RSI indicator from top to bottom. A buy signal emerges when the lower envelope/border is broken by the RSI indicator from bottom upwards. The indicator can draw arrows on the indicator, draw vertical lines
FREE

Smart Fibo Zones are powerful, auto-generated Fibonacci Retracements that are anchored to key market structure shifts . These zones serve as critical Supply and Demand levels, guiding you to identify potential price reactions and confirm market direction. Fibonacci calculations, widely used by professional traders, can be complex when it comes to identifying highs and lows. However, Smart Fibo Zones simplify this process by automatically highlighting order blocks and key zones, complete with St
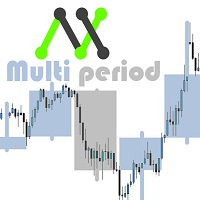
Com este indicador personalizável você poderá observar outros prazos além do habitual. Dessa forma, você conhecerá melhor o ambiente geral em que o preço se move e provavelmente será melhor sua eficácia. *É importante que o prazo no indicador seja maior do que o estabelecido no Metatrader. Compartilharei mais indicadores de graça em breve. Se você tem alguma ideia específica de um indicador que você quer ter você pode escrever-me uma mensagem privada diretamente. Opiniões, avaliações, sugestões
FREE
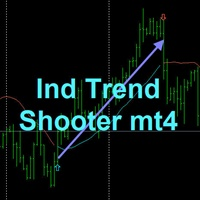
TREND SHOOTER Without alerts
It is a trend indicator based on moving averages that very efficiently calculates changes in market direction.
This has the ability to anticipate changes of direction very early.
FEATURES
This indicator particularly draws two moving averages that are used only to show color changes. they can wear these moving stockings as they wish as they do not affect the color change behavior bullish blue color
bearish red color where the line is interrupted it is not reco
FREE

Unleash Your Trading Potential with the Apex Trend Detector! Are you tired of missing out on profitable trades? Do you struggle to find reliable entry and exit points in the volatile forex market? It's time to upgrade your trading arsenal with the Apex Trend Detector – the intelligent MT4 indicator designed to cut through market noise and pinpoint high-probability trading opportunities! The Apex Trend Detector isn't just another indicator; it's a sophisticated signal system that expertly fuses t
FREE

IntradayMagic прогнозирует характер ATR и тиковых объёмов на 1 сутки вперёд. Индикатор не перерисовывается и не отстаёт. Используя Intraday Magic вы можете значительно повысить качество торговли и избежать излишних рисков. По его показаниям можно детектировать кризисные состояния рынка и моменты разворота тренда, уточнять моменты и направления входов. Это бесплатная ознакомительная версия ограничена символами (парами) включающими GBP. Никаких иных ограничений нет. Для других пар вы можете исполь
FREE

This indicator does not process the price chart data and does not provide trading signals. Instead, it is an application to compute and display the frequency response of many conventional indicators. Moving averages like the SMA, LWMA and EMA, and oscillators like the MACD, CCI, Awsome Osc, all have the form of digital filters. Electronic engineers use a special method to characterise the performance of these filters by studying their frequency response. Two important quantities of the freque
FREE

Análise de trading precisa na ponta dos dedos: software de análise de trading de última geração O software de análise de trading convencional disponível no mercado geralmente fornece apenas estatísticas de índice de lucro e perda por hora ou semana, o que não atende à necessidade de uma análise de trading mais precisa. No entanto, no mercado de trading real, cada dia apresenta circunstâncias únicas. As segundas-feiras são tranquilas, as quartas-feiras são ativas com juros noturnos triplos e as
FREE

This indicator is designed for scalping in the Forex market and trading binary options. A signal appears at the opening of a new candle. Usage Recommendations: For Binary Options: It is recommended to open trades when a signal appears on the first candle. A buy signal appears when the blue X replaces the red one, while a sell signal occurs when the red X replaces the blue one, as shown in the screenshots. For the Forex Market: Enter a trade when a signal appears as described above. It is advisa
FREE

!!! Em [CodeBase] publiquei o código do indicador Mql4. Baixe o código gratuitamente !!! (Você deve adaptar o código ao atualizar o terminal).
Este indicador é uma ferramenta do trader. Mostra o movimento da estocástica em todos os períodos e símbolos: М1, М5, М15, М30, Н1, Н4 a cada minuto (a escala de tempo do atual até -240 minutos, ou seja, as últimas 4 horas).
Step_Stoch supera a desvantagem dos indicadores estocásticos - lagging. Por exemplo, um aumento após uma queda em H1 (ou M30) depo
FREE
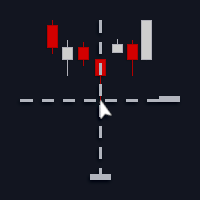
A simple crosshair indicator for MT4. Main features Displays crosshair guidelines (price/time) that follow your mouse cursor, allowing you to check chart information intuitively. Designed to minimize calculations, so it runs lightweight and has minimal impact on chart performance. When the mouse cursor leaves the chart area, the crosshair automatically disappears, so unnecessary lines won’t remain on the chart.
Recommended for Those who want to improve the efficiency of top-down analysis and ov
FREE
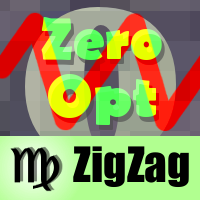
This is yet another non-parametric ZigZag. Its every upward edge continues until next bar's high is formed below highest low of its bars, and every downward edge continues until next bar's low is formed above lowest high of its bars. In addition to zigzag itself (shown in orange color), the indicator shows signal marks on those bars where zigzag direction changes. The blue arrow up denotes that new bullish edge is started (but not yet completed), whereas the red arrow down denotes that new beari
FREE

Indicator ini berdasarkan Gain ADX - Follow Trend - Disertai Pivot, Support & Resistant Daily
Dengan indicator ini semoga menjadikan indicator yang porofit able, selama mengikuti signal yang tampil, apabila berwarna Hijau siap2 untuk Buy, dan berwarna Merah siap2 untuk Sell.
Akan tampil signal Sell/Buy di saat gain mencukupi, baik TF Kecil maupun TF Besar TF Besar / High TF adalah Trend Kuat TF Kecil / Low TF adalah Trend Lemah
Open Posisi pada High TF, signal akan menunjukkan Sell/Buy.
FREE

Este indicador irá ajudá-lo a traçar as linhas do horizonte ( Marcelo Ferreira ) do Grafico semanal. Você poderá mudar trabalhar por exemplo em M5 ou M15. As linhas semanais permanecerão lá. Analisar as tendências em gráficos semanais antes de fazer uma entrada no mercado Forex é essencial para identificar a direção predominante do mercado a longo prazo. Esse tipo de análise ajuda a evitar decisões impulsivas baseadas em flutuações de curto prazo e fornece uma visão mais clara sobre o movimento
FREE

Rsi indicator and Stochastic Combined into one indicator , the Supreme StochRsi doesnt repaint / Back-paint / delay. can be used as overbought oversold strategy , or trend following on 50 level cross. if you like this indicator please check my Supreme Trendhisto: here , and my Supreme Diamond indicator : here ========================================================================= Parameters : Stochastic K and D value , Stochastic period Rsi Period Rsi price ====================================
FREE

ATR Moving Average draws a moving average of the standard Average True Range( ATR ) in the same window.
Settings Name Description ATR period
Set Price per iod for ATR calculation
ATR level Set ATR value for thresholding( only whole number, ignore leading zeros e.g. 0.00089 = 89 ) MA Period Set moving Average Period MA Method Set moving average method( Simple, Exponential, Smoothed and Linear Weighted ) MA Shift
Set moving average shift
Enable Alerts ? Generate Alert when ATR Crosses
FREE
Highly configurable RSI indicator. Features: Highly customizable alert functions (at levels, crosses, direction changes via email, push, sound, popup) Multi timeframe ability Color customization (at levels, crosses, direction changes) Linear interpolation and histogram mode options Works on strategy tester in multi timeframe mode (at weekend without ticks also) Adjustable Levels Parameters:
RSI Timeframe: You can set the current or a higher timeframes for RSI. RSI Bar Shift: you can set t
FREE
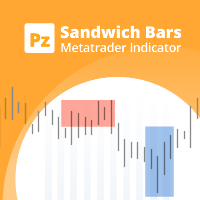
Spot high-probability trades: sandwich bar breakouts at your fingertips This indicator detects Sandwich Bars of several ranges, an extremely reliable breakout pattern. A sandwich setup consists on a single bar that engulfs several past bars, breaking and rejecting the complete price range. [ Installation Guide | Update Guide | Troubleshooting | FAQ | All Products ] Easy and effective usage Customizable bar ranges Customizable color selections The indicator implements visual/mail/push/sound aler
FREE
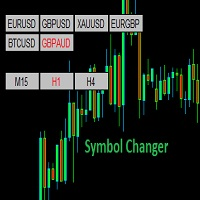
Symbol Changer (Custom) Indicator
This is a simple yet intuitive indicator. And its free.
The indicator provide easy navigation across various symbols and across different time frames all in a chart.
The buttons are displayed on the main chart.
It is flexible and easy to use with fast response speed.
FEATURES
UniqueID : This identifies the pairs for each chart
Use Custom Pairs : If set to true, load all the available symbols in the Market Watch. No means it loads the pairs selected be
FREE

How To Trade
Execute your trades in 3 Easy Steps!
Step 1: Trade Setup Entry Buy in Line color Blue Touch on line color Red. Entry Sell in Line color Blue Touch on line color Green. Success Rate ≥ 80% 100:20 depend your experience and fast your take. Step 2: Set Stop Loss Stop loss BUY ----> You can not put stoploss with a fixed price, your speed in determining the closing request------>Line color Blue Touch on line color Green. Stop loss SELL ----> You can not put stoploss with a fixed price, yo
FREE

This indicator is a useful tool for visualising cyclic components in price. It calculates the Discrete Fourier Transform (DFT) of a price chart data segment selected by the user. It displays the cycles, the spectrum and the synthesised signal in a separate window. The indicator is intended as a learning tool only, being unsuitable for providing actual trade signals. Download the file - it is a free toy. Play with it to understand how signals can be transformed by controlling their cyclic comp
FREE
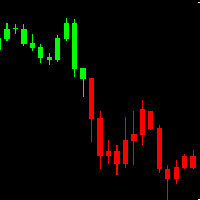
AH Candles MT4 AH Candles MT4 is a new product that allows identifying the current market phase (uptrend and downtrend ).
This indicator paints bars in different colors depending on the current state of the market trend ( Green and Red )
AH Candles MT4 is use for trading currencies
Advantages Suitable for intraday and swing trading. The indicator base on EMA method to calculate Period Parameters It can be used as a standalone tool or together with other indicators.
How to use the prod
FREE

Whether you are a scalper or daily trader, you will always look for bullish / bearish engulfing candles. This can be a bit tricky and stressful when you try to visually identify the engulfing candles on the chart. Not only that, you might be trading on the M15 time frame but the engulfing candle is forming or has already formed in the H4 time frame. This indicator is made to do that on your behalf. You can trade on any time frame and see Engulfing candles of another time frame, this means that y
FREE

AdvaneZigZag Indicator
Are you tired of the limitations of the traditional ZigZag indicator? Meet AdvaneZigZag, the ultimate tool to simplify your market structure analysis and enhance your trading strategies. Designed with flexibility and precision in mind, AdvaneZigZag brings you advanced features to navigate the market with confidence.
Key Features:
1. Enhanced Flexibility:
- While maintaining the familiar simplicity of the conventional ZigZag indicator, AdvaneZigZag offers superior a
FREE

Having to check constantly if your Stochastic has reached a specific level can be tedious and draining at times, especially if you have to monitor different asset classes at a time. The Alert Stochastics indicator will assist in this task, ensuring that you get the most with little effort. When the Stochastic values get to a specified level, the alerts will go off, on the chart, on the MT4 phone app or via email (You can receive text messages to your phone if you activate texts on your Gmail acc
FREE
Simple indicator that shows your history in pips and profit. You can use it to follow your progress on the positions. It shows you the trade progress only for the symbol that the indicator is on and only for your trade history. Label text is updated when order is closed. The text can be displayed on each corner, it is in the parameters.
Basic input parameters: Label color Font size Conrner position Anchor position Note: corner and anchor have to be the same position.
FREE

The All Averages Scanner Dashboard is an MT4 Indicator designed to show the current state of different kinds of Moving averages. Read the blog post for detailed explanation with screenshots: https://www.mql5.com/en/blogs/post/762972
It is great if you are testing out different kinds of moving averages with respect to price and other averages. Also if your strategy is based on MA Stacking one on top of another, you can use this for validation. You can also create Custom baskets as shown below f
FREE

Limited time offer! For the launch of NextBot Scalper EA , the price of this indicator will drop to FREE !
Introducing a pragmatic and innovative tool for MetaTrader 4 (MT4) traders: the Linear Regression Next channel indicator, enhanced with the determination coefficient R 2 . This indicator serves as a foundational tool for traders seeking to understand market trends through the lens of statistical analysis, specifically linear regression.
The essence of this indicator lies in its ability t
FREE

Título do produto Smart Bulls (MT4) – parte da série SmartView Descrição breve Indicador Bulls com experiência de usuário única na plataforma MetaTrader. Oferece capacidades avançadas não disponíveis anteriormente, como abrir configurações com duplo clique, ocultar e mostrar indicadores sem excluí-los, e exibir a janela do indicador em tamanho completo do gráfico. Projetado para funcionar perfeitamente com o restante da série SmartView Indicators. Visão geral A série SmartView oferece uma experi
FREE

Visão Geral do Indicador Aroon Classic O indicador Aroon Classic é uma ferramenta técnica que identifica quantitativamente o surgimento e a persistência de tendências em um gráfico. Ele utiliza duas linhas — “Aroon Up” e “Aroon Down” — para mostrar a força da tendência e os pontos de reversão em uma faixa de 0 a 100. Um valor alto de Aroon Up indica uma tendência de alta forte, enquanto um valor alto de Aroon Down indica uma tendência de baixa forte. Principais Características Distingue visualme
FREE

Highly configurable Awesome Oscillator (AO) indicator. Features: Highly customizable alert functions (at levels, crosses, direction changes via email, push, sound, popup) Multi timeframe ability Color customization (at levels, crosses, direction changes) Linear interpolation and histogram mode options Works on strategy tester in multi timeframe mode (at weekend without ticks also) Adjustable Levels Parameters:
AO Timeframe: You can set the current or a higher timeframes for AO. AO Bar Shift:
FREE

L'indicatore Go Trend è un indicatore personalizzato per MetaTrader 4 (MT4) basato su una logica di ZigZag con tre livelli di periodi diversi.
Questo indicatore è progettato per identificare i punti di inversione del prezzo (massimi e minimi) su diversi timeframe, aiutando i trader a individuare potenziali trend e punti di ingresso/uscita nel mercato.
Funzionalità Principali Identificazione dei Punti di Inversione (ZigZag) L'indicatore utilizza una logica di ZigZag per tracciare linee che coll
FREE
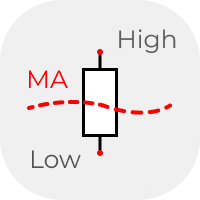
The classic idea of comparing the size of candles. Above / below - the average for a certain period. Usually used on D1, W1 and higher timeframes in candlestick analysis patterns. But you can also use the data from the indicator in your analysis system. The data is presented as a histogram in a separate window. The averaging method can be selected in the settings.
FREE

You can see resistance and support levels with the Gann Square 9 calculator. You can adjust the sensitivity setting to suit your needs and the symbol. If you leave the sensitivity at 0, it will work with the default values. I recommend adjusting it to suit your needs and the symbol. Good luck.
I plan to improve the Gann Square 9 indicator and create signals in the next version. If you have any requests, please leave them in the comments. Thank you.
FREE
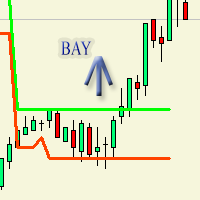
Индикатор изначально предназначался для торгового робота который в дальнейшем опубликуется. Рисует на графике флет. То-есть покой тренда. Очень отчетливо выражает флет по параметрам по умолчанию. flateWigth - допустимая ширина или разница между барами по которому индикатор будет засчитывать флет. Индикатор работает в реальном времени. Для наглядного просмотра работы можно запустить в тестере.
FREE
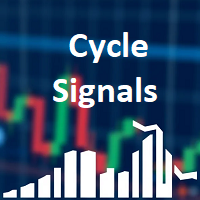
Cycle Signals Indicator. Gives signal on price range cycling and smoothed with algorithm. There are very small parameters: allow alerts (Pop Up or Email), colors for chart arrows, timeframe to use for calculation (but better to use current timeframe). And most important parameter is "period". For low timeframes high values are recommended. Current period is good for M5. Decrease it for higher timeframes. Close trade arrows will come soon. MT5 version comes soon (but with some small price).
FREE
As we know, МТ4 and МТ5 do not store tick history, which may be necessary to develop trading strategies and market analysis. I have developed a method allowing you to receive tick history very easily. The indicator gathers tick history in real time and writes it to XXXXXX2.hst file, where XXXXXX is a symbol name. This file can be used to create an offline chart or something else. If you use a trading robot, then launch the indicator and control your broker by examining the spread and quotes. All
FREE
Search for an entry with low risk for trading by Lisek Moving Average Indicator. There are many ways to trade with Lisek Moving Average Indicator: Trend continuation (Trend trading). Trade pullbacks (Range trading). Trade breakouts. Trade reversals. Take profits or set stop-loss based on your MA.
Moving Averages are a frequently used technical indicator in forex trading, especially over 10, 50, 100, and 200 periods. Moving Averages are lagging indicators, which means they don't predict where p
FREE

Simulator for Risk / Reward ratio calculator We-RiskReward is a MT4 indicator made by the We-Trading team to simulate an order with Risk / Reward calculator.
Horizontal Lines This indicator show you 3 horizontal lines that are: Open line Take Profit line Stop Loss line You can move the lines and you will see R/R and Lots calculation in real time. You can use it to simulate Long and Short positions.
Indicator parameters As input parameters you need to check only the Risk for trade. For e.g. you
FREE

The indicator measures volumes on different charts and instruments. Its main advantage is the ability to compare separate brokers. The less Middle Volume and Tick / Second , the more reliable is the broker. There is a comment in the upper left corner Comment data: Tick/Second — number of ticks per second for a selected instrument Middle Volume — average volumes in the penultimate bar This indicator allows tracking a relative market activity for different timeframes. If the volumes are lower than
FREE
The purpose of this new version of the MT4 standard indicator provided in your platform is to display in a sub-window multiple timeframes of the same indicator. See the example shown in the picture below. But the display isn’t like a simple MTF indicator. This is the real display of the indicator on its timeframe. Here's the options available in the FFx indicator: Select the timeframes to be displayed (M1 to Monthly) Define the width (number of bars) for each timeframe box Alert pop up/sound/ema
FREE
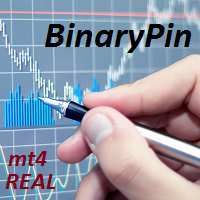
BinaryPin is an indicator developed and adapted specifically for trading short-term binary options. The indicator's algorithm, before issuing the signal, analyzes many factors, such as market volatility, searches for the PinBar pattern, calculates the probability of success when making a deal. The indicator is set in the usual way. The indicator itself consists of an information window where the name of the trading instrument is displayed, the probability of making a successful transaction, the
FREE

The Oscillators histogram indicator is designed to show the histogram of some oscillator indicators. These oscillators are RSI, Momentum, ATR and CCI indications. Our Popular Products Super Oscillator HC Cross Signal Super Cross Trend Strong Trend Super Signal Parameters Oscillators - indicator name. Period - indicator period. Level indicator - indicator level. MAPrice - applied price for Momentum, CCI or RSI. Alerts - enable/disable alerts. Email Notification - enable/disable Email notifica
FREE

This indicator helps you to scan all symbols which are in the Market Watch window and filter out a trend with alerts. It works on five most effective indicators which are used by most of traders for trading: Moving Average Average Directional Moment (ADX) Relative Strength Index (RSI) Parabolic SAR MACD It calculates two bars for scanning. When box colour changes to coral or royal blue colour, it indicates you for trend change for long and short entry. And also you will get alert on screen. When
FREE
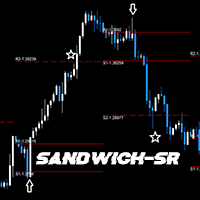
GENERAL DESCRIPTION
Simple SR Projection based on selected instrument's historical data. Best used in conjunction with current market sentiment, and fundamental analysis. Currently limited to selected pairs due to of historical data to project accurate levels.
Generally, for support and resistance, 2 levels are drawn, respectively. The inner levels (R1,S1) project the highs and lows during the opening stages of selected time frame. The outer levels, represent the targets to reach during the clo
FREE

Channels indicator does not repaint as its based on projecting the falling and raising channels. As a trader you need a path to be able to place your buy and sell trades such as: Supply and Demand , Falling & raising channels. Falling and raising channels can be in any time frame and also can be in all time frames at the same time and the price always flows within these channels. Experienced trades will draw the key levels and channels around the timeframes. But, they will not be able to draw
FREE

The Stochastic RSI indicator (StochRSI) is essentially an indicator of an indicator. It is used in technical analysis to provide a stochastic calculation to the RSI indicator. This means that it is a measure of RSI relative to its own high/low range over a user defined period of time. The Stochastic RSI is an oscillator that calculates a value between 0 and 1 which is then plotted as a line. This indicator is primarily used for identifying overbought and oversold conditions.
FREE

Индикатор показывает максимальное отклонение от скользящей средней за заданный период. Границы канала могут послужить своего рода зонами перекупленности/перепроданности, от которых может произойти откат цены к центру канала. За этими уровнями и стоит искать дополнительные сигналы для входа в сделку. В настройках индикатора всего 2 параметра - период, за который будет расчитываться индикатор и метод усреднения скользящей средней.
FREE

The indicator calculates the average price velocity over the specified time period. It is known that the trading time flows unevenly, in bursts. It either goes faster, or slows down. This indicator will tell if the trading time has accelerated and it is necessary to go to the smaller timeframes to search for trade signals.
Usage Alert is generated when the price velocity exceeds the specified threshold. The threshold value can be modified using the buttons on the information panel. A .wav file
FREE

MetaTrader indicator that detects WRBs (Wide Range Bodies/Bars) and Hidden Gaps.
WRB Hidden Gap MetaTrader indicator detects WRB and marks it. WRB can be either a Wide Range Bar (a very large bar) or a Wide Range Body (a candlestick that has a very long body). WRB alone do not provide much information so the indicator uses WRB to detect Hidden Gaps. The indicator also displays filled and unfilled Hidden Gaps in a different way, making it easier to view the market situation at a glance
FREE
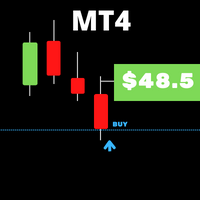
Quando se trabalha com vários ativos e tem várias posições abertas em ativos diferentes é um pouco complicado de visualizar quando de lucro o prejuízo cada ativo está dando, então com esse problema em mente desenvolvi esse indicador onde ele facilita a visualização das operações abertas em cada ativo, onde você poderá abrir vários ativos diferentes e poderá visualizar o resultado individual de cada ativo e agilizar a sua tomada de decisão nos seus trades.
FREE

Trendy Stock is a price following indicator that uses Stochastic to show when the price is out of the oversold or overbought areas. The algorithm allows you to stay longer in a trend where the bulls or bears are in control. The indicator changes color immediately the price exits oversold/overbought state. In short, the downtrend [red] bars start to paint when the buying pressure decreases while the uptrend [green] bars form as the buy pressure kicks in. For MT5 version, follow :: https://w
FREE
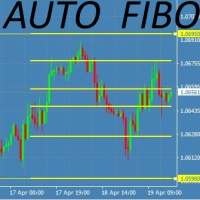
This Fibonacci Indicator is showing fibo retracement lines on chart for EA trading same as the default tool from Metatrader's menu, except this one is fully automatic and changes along with the chart (with modes B and C, then mode A is always fixed by set levels)
AND it also offers the line levels for the Expert Advisors to read (buffers) , so you can set your trades based on crossover\crossunder on those fibo lines.
You can choose from 3 modes for selecting the max HIGH and min LOW limit,
and
FREE

The Investment Castle Chances indicator will show signals on the chart for entering a buy or sell trade. There are 2 types of signals for each direction as follows: Buy / Sell (Orange colored candlesticks) Strong Buy (Green colored candlesticks) / Strong Sell (Red colored candlesticks) You may place a buy trade once you see the Buy arrow or vise versa, or you might prefer to wait for a further confirmation “Strong Buy” / “Strong Sell”. This indicator works best with the high time frames H1, H
FREE

The Ultimate Trading Companion: Beyond the Bands Tired of missing out on key market moves? Our indicator, Beyond the Bands , is the solution you've been waiting for. This powerful tool takes the classic Bollinger Bands strategy and supercharges it with an intelligent EMA filter, giving you more accurate and reliable signals than ever before. It's designed to help you find high-probability entry points and avoid false signals, so you can trade with confidence. What makes Beyond the Bands differen
FREE
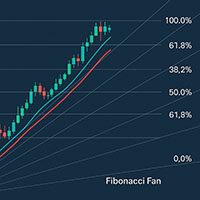
Indicator Description "Double Moving Averages with Fibonacci Fan" is a powerful MetaTrader 4 (MT4) tool designed to enhance trend analysis by combining: Two customizable Moving Averages (MA1 & MA2) for dynamic crossover signals. Fibonacci Retracement Levels to identify key support/resistance zones. Fibonacci Fan for projecting trend direction and potential reversal angles. Key Features: Dual MA System – Track short-term vs. long-term trends (e.g., EMA 9 + SMA 21).
Smart Alerts – Popup, email
FREE
MT Rider — Multi Time-Frame Trend Indicator (Free Edition) Important Update for All MT Rider Users We have created an official community space , where all future improvements, upgrades, and additional tools will be released.
This includes: ️ upcoming upgraded versions of MT Rider
️ access to the MT4 OneClick trading panel
️ early previews of new tools
️ support and helpful resources
️ direct communication and announcements If you already have MT Rider downloaded here on MQL5, you are wa
FREE

Corretora recomendada para utilizar o indicador: https://tinyurl.com/5ftaha7c
Indicador desenvolvido por Diogo Sawitzki Cansi para mostrar possíveis pontos de trade. Não repinta. Os resultados exibidos no passado são exatamente o que ocorreu. Utilizamos também para segurar trades por mais tempo e não sair em sinais falsos de reversão que na verdade são apenas uma realização de lucro dos trades e ninguém está tentando inverter a direção da tendência. Parâmetros do Indicador: PERIOD: Período para
FREE

This is an extension of the previous published DollarIndex with the addition of the function for calculating EURO Index under ICE Formula. Note that the broker should provide the following data:
For Dollar Index formula, EURUSD, USDJPY, GBPUSD, USDCAD, USDSEK and USDCHF are needed. For Euro Index formula, EURUSD, EURGBP, EURSEK and EURCHF are needed. Now in this version if the SEK (the most uncommon) is not provided, the formula still works, since it adds 0.0001 to its value, but the index will
FREE

This indicator shows us the trend or direction of the market and a possible stop loss
This indicator works with two parameters, period and multiplier. Buy and sell signals are generated when the indicator crosses the closing price and it changes color.
This indicator is used in all types of markets such as stocks, futures, forex, cryptos, additionally it can be used in different time periods: hours, daily, weekly, etc.
It is recommended not to use it while the market is sideways, this can be
FREE

Supreme Direction is an indicator based on market volatility , the indicator draws a a two lined channel with 2 colors above and below price , this indicator does not repaint or back-paint and signal is not delayed. how to use : long above purple line , short below golden line. Parameters : channel period ========================================================
FREE

A powerful trend analysis tool for traders of all levels Super Trend Analyzer is a technical analysis tool that uses the Relative Strength Index (RSI) and Moving Average (MA) indicators to identify trends in the market. It is a versatile tool that can be used by traders of all levels of experience.
How does it work An uptrend begins when the main trend line and the auxiliary trend line cross from below and the lower minor oscillator is on the rise. A downtrend begins when the main trend line an
FREE

RaysFX EMA Crossover Scopri i potenziali punti di inversione del mercato con l’indicatore di Crossover EMA di RaysFX. Questo indicatore utilizza una combinazione di due medie mobili esponenziali (EMA) - una più veloce e una più lenta - per identificare i possibili punti di ingresso e uscita. Caratteristiche principali : Due EMA : Utilizza una EMA più veloce e una più lenta per catturare i movimenti di mercato a breve e lungo termine. Segnali di crossover : Genera un segnale quando l’EMA più v
FREE
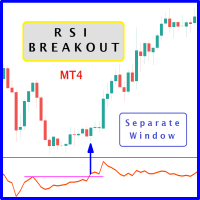
The likelihood of farther price movement increases when the Relative Strength Index oscillator "RSI" breaks through its historical resistance levels in conjunction with prices breakout of resistance levels. It's strongly encouraged to confirm price breakout with oscillator breakout since they have comparable effects to price breaking support and resistance levels; similar perception is applied to short trades. Concept is based on find swing levels which based on number of bars by each side to co
FREE
AC Pivot Panel – Your Ultimate Pivot Trading Tool The AC Pivot Panel is a powerful yet user-friendly pivot point indicator designed to help traders identify key support and resistance levels with ease. Whether you’re a beginner or an experienced trader, this indicator simplifies pivot trading and enhances your decision-making process. Key Features : Interactive Selection Panel : Easily adjust pivot settings directly on the chart with a compact and intuitive panel. Multiple Pivot Methods : C
FREE

Here is the most unpretentious indicator to use, but one of the most useful. It signals the near reversal of the growing volatility. It is volatility that gives income to the trader. The indicator is especially useful for those who do not want to wait for the right moment in front of the monitor. The indicator is installed on the charts M15 and M30. According to the observations on these timeframes, it best fixes the approach of wide price waves. Well-established on the USDZAR currency pair (Att
FREE
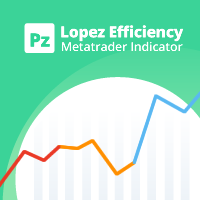
Este indicador analisa a eficiência do movimento atual do mercado, com base na verdadeira relação alta / baixa de um determinado número de barras. [ Guia de instalação | Guia de atualização | Solução de problemas | FAQ | Todos os produtos ] O rácio é a eficácia do movimento do mercado Uma relação abaixo de 1 significa que o mercado não está indo a lugar algum Uma relação acima de 1 significa que o mercado está começando a mostrar direcionalidade Uma relação acima de 2 significa que o mercado es
FREE

The Bolliger Bands On-Off let you control the indicator using the keyboard or a button . You can choose if you want the indicator always shown or always hided while switching among different time frames or financial instruments . ---> This indicator is part of Combo Indicator OnOff
The Bollinger Bands identify the degree of real-time volatility for a financial instruments . A lower amplitude corresponds to a low volatility, conversely a greater bandwidth corresponds to high volatility. Na
FREE

Candle Pattern Alert indicator alerts when the last price closed candle matches the set input parameters. You can choose to scan through all the symbols in Market Watch or enter your favorite symbols and also you can enter time frames you need to scan. --------- Main settings- ------- Select all symbols from Market Watch? - if Yes the program scans through all the symbols displayed in Market Watch, if No - only selected in next input symbols are scanned
Enter symbols separated by commas - enter
FREE
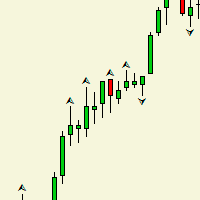
Индикатор рисует на графике фрактал, и в чем отличие между обычным фракталом? спросите вы. Ответ таково,_ после формирования второго бара фрактал рисуется и не удаляется в отличие от обычного. Данный индикатор создан в целях расширения Торгового робота. Она составляет одним из важнейших частью робота. Таким как выход из торгов. У индикатора нет входных параметров.
FREE
O mercado MetaTrader é um espaço, sem precedentes, para negociar robôs e indicadores técnicos.
Leia o artigo Manual do usuário da MQL5.community para saber mais sobre os serviços exclusivos que oferecemos aos traders: cópia de sinais de negociação, aplicativos personalizados desenvolvidos por freelances, pagamentos automáticos através de sistema de pagamento e a rede em nuvem MQL5.
Você está perdendo oportunidades de negociação:
- Aplicativos de negociação gratuitos
- 8 000+ sinais para cópia
- Notícias econômicas para análise dos mercados financeiros
Registro
Login
Se você não tem uma conta, por favor registre-se
Para login e uso do site MQL5.com, você deve ativar o uso de cookies.
Ative esta opção no seu navegador, caso contrário você não poderá fazer login.