Candle Compass PRO MT5
- Indicators
-
Pawel Drucis
 Welcome to YOX Trade!
With more than 20 years of experience in the trading industry, YOXO Trade develops and provides professional software solutions designed to support traders in their everyday trading activities. - Version: 2.0
CANDLE//COMPASS PRO
A tribute to pure price action
Before indicators, oscillators and algorithms, there was the candle. Open, high, low, close: four numbers that tell the whole story of a battle between buyers and sellers. Candle Compass was built on that idea. It doesn’t predict, it doesn’t hide the chart behind lines and noise. It shows you where you stand.
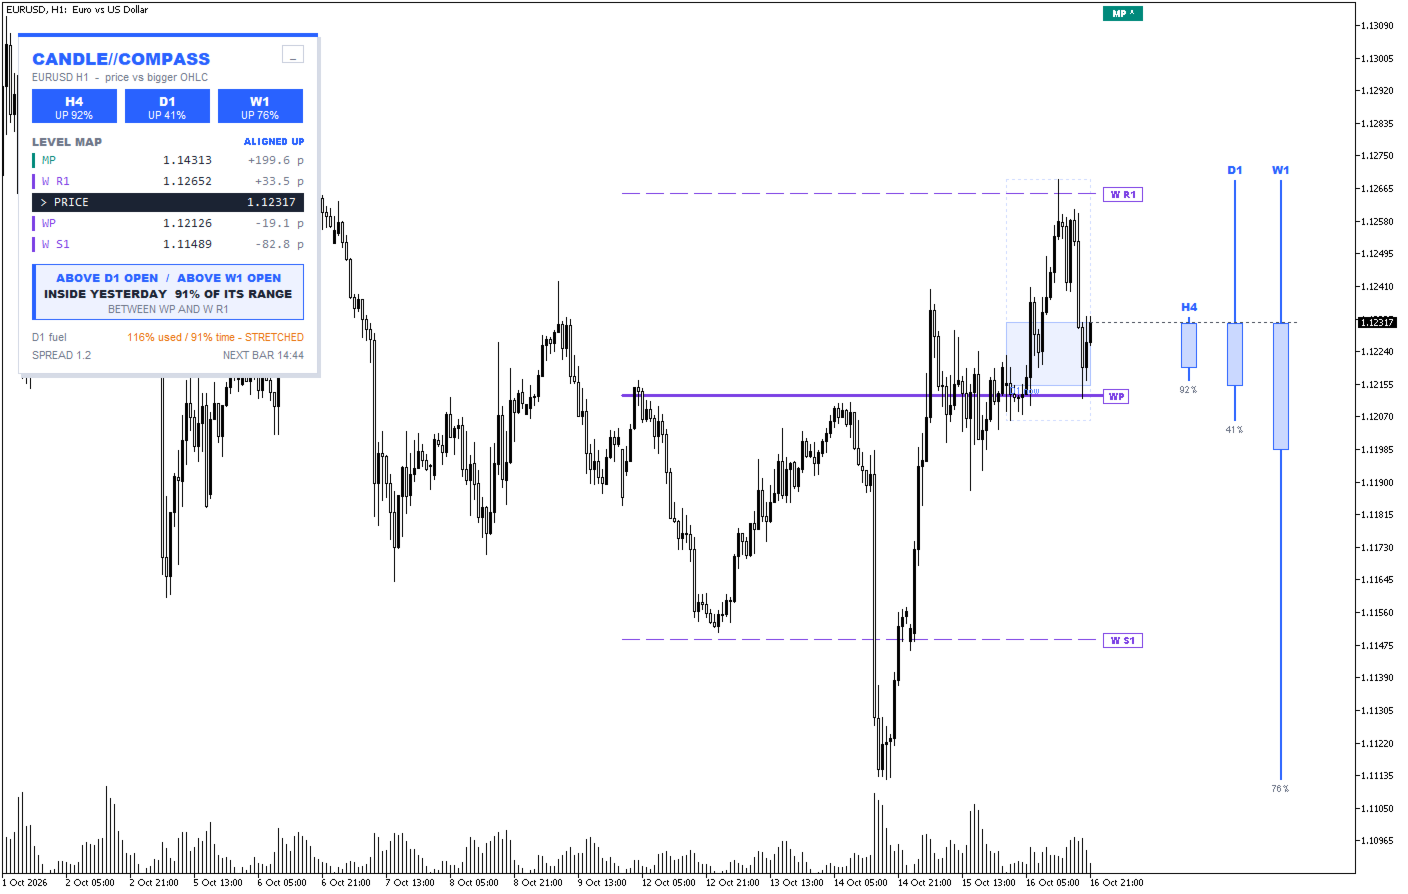
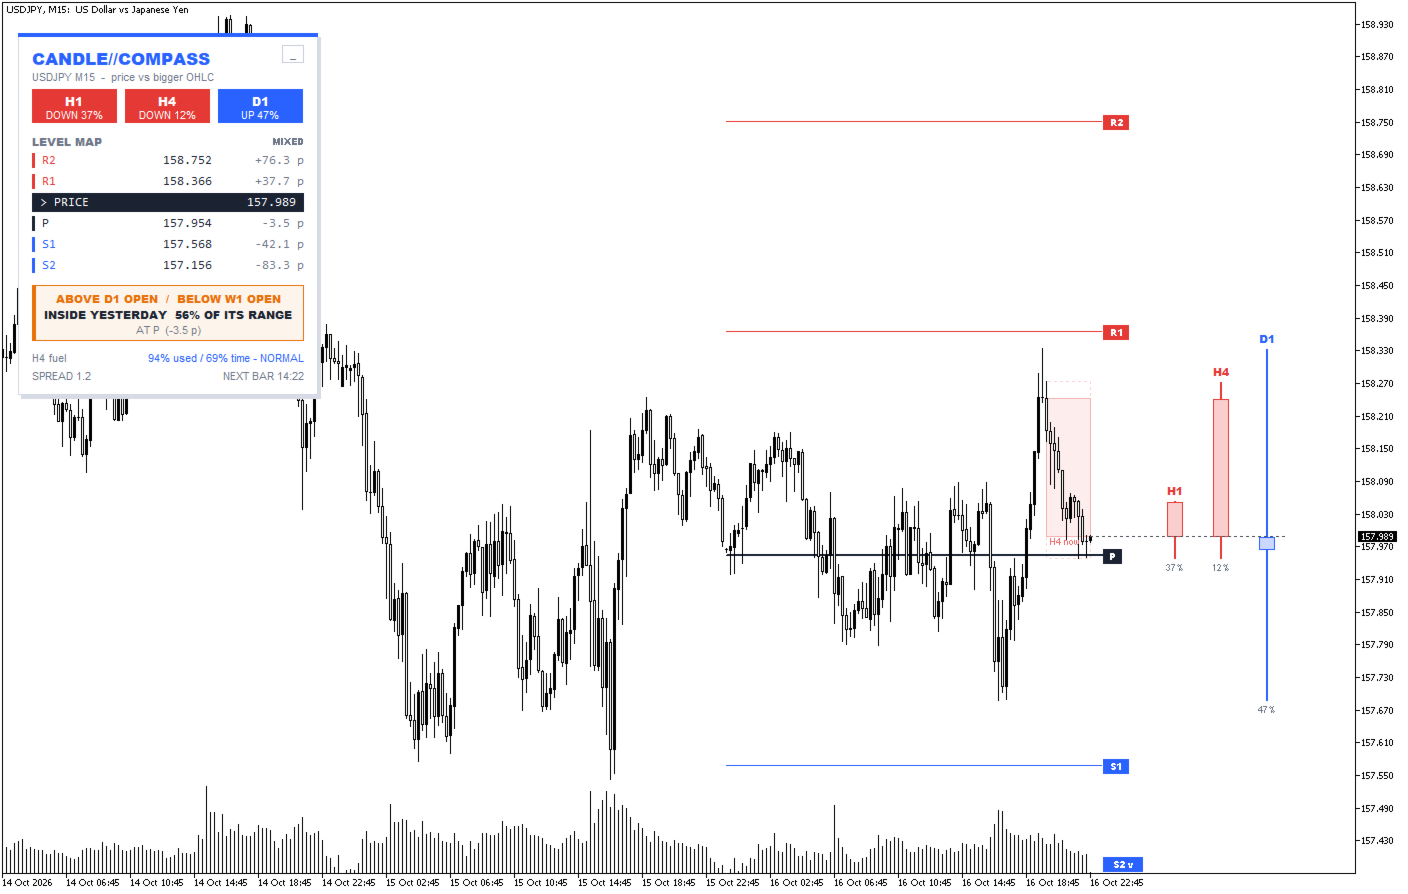
Every trader looks at small candles, but the market is driven by the big ones. The daily, weekly and monthly candles are where the real decisions are made, and Candle Compass keeps them in front of you all the time. The forming higher-timeframe candles sit quietly in the right margin, at the true price scale, so one glance tells you whether price is near the top or the bottom of the bigger picture and which way it is leaning.
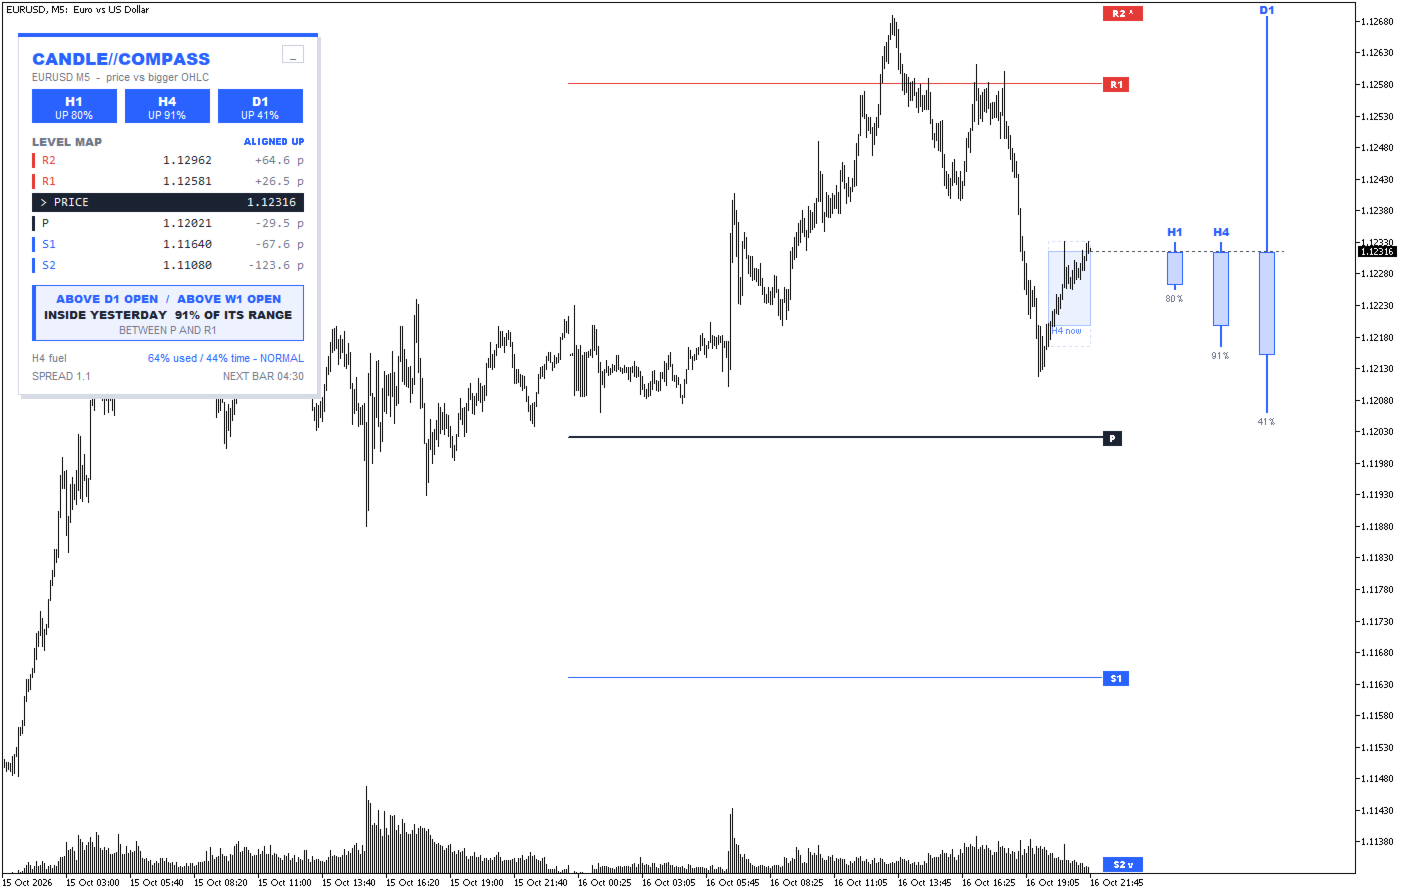
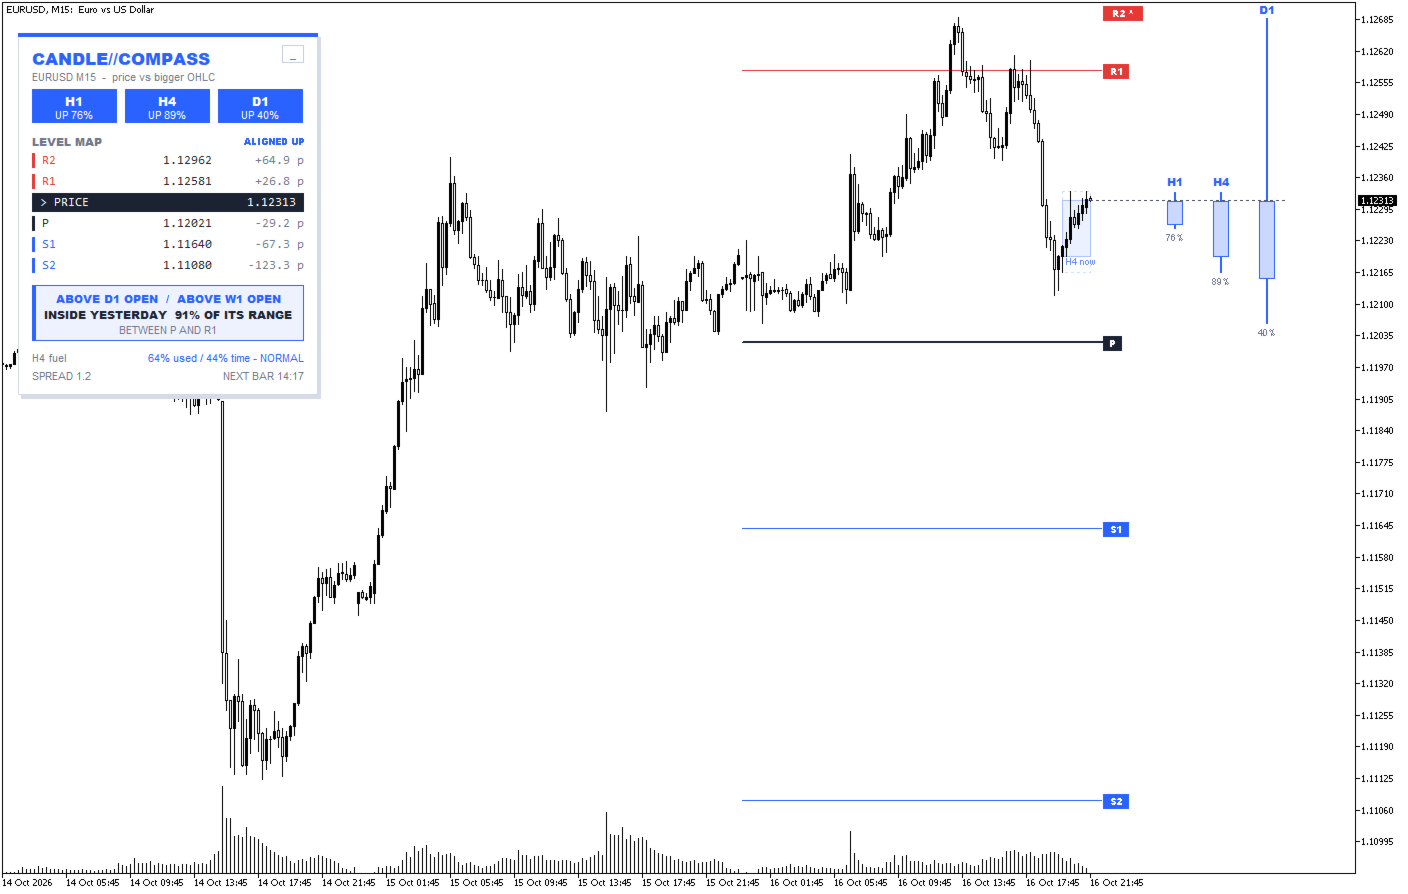
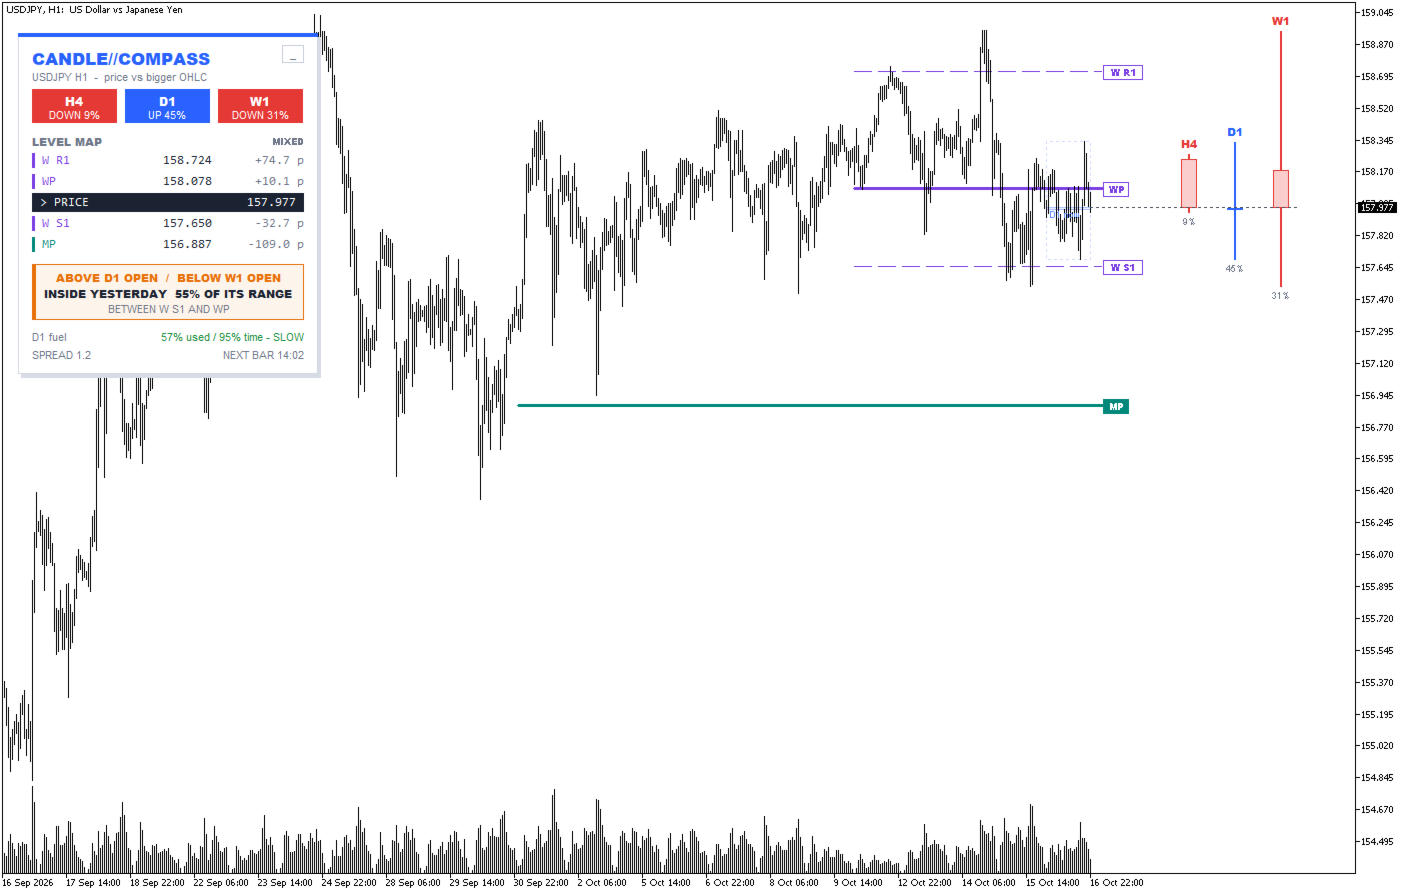
The levels traders have respected for decades are drawn cleanly and only where they matter. On intraday charts these are the daily pivots. On higher timeframes they are the weekly and monthly pivots. There is no clutter and no history spaghetti, just the current picture.
The panel answers the questions every price action trader asks before taking a trade. Are we above or below today’s open? This week’s open? Are we inside yesterday’s range or breaking out of it? Which level is next above me, and which is below? How much fuel does the bigger candle have left?
Clean on white charts, clean on dark charts, light on resources and honest by design. Candle Compass doesn’t trade for you. It gives you a sense of direction and lets the candles do the talking.
MAJOR FEATURES
Compass candles
The forming higher-timeframe candles are drawn in the right margin at the true price scale, for example H4, D1 and W1 on an H1 chart. A dotted line marks the current price, so you instantly see where price sits inside each bigger candle. They are selected automatically for your chart timeframe, or you can choose them yourself.
Clean chart by design
Only the current bigger candle is shown, as a soft box behind price. History shadows, open lines and range limits are all optional, so the chart stays readable even when the market has no clear trend.
Pivot levels that fit your timeframe
- The weekly and monthly pivots are drawn as bold lines from the start of their week or month.
- You can choose Classic, Fibonacci, Woodie or Camarilla calculation.
- Only the nearest levels around price are drawn, and each has a clear coloured tag on the right.
- A level outside the visible price range is pinned to the chart edge with an arrow, so you never lose it.
Direction chips
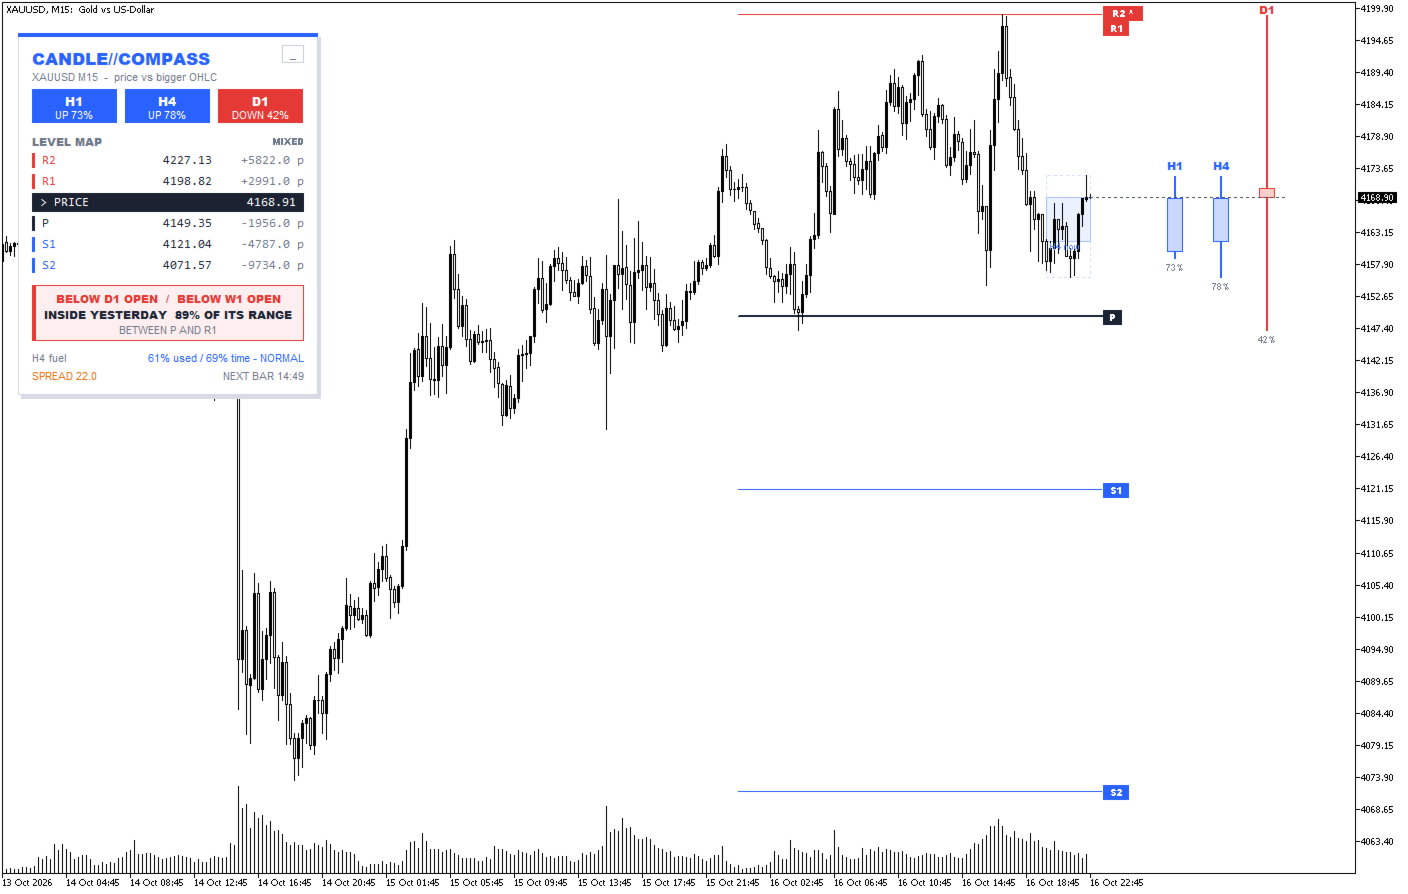
Three coloured chips show whether each bigger candle is currently up or down, and where price sits inside its range (0% = at the low, 100% = at the high).
Level Map
A compact ladder in the panel lists the levels above and below price with their exact distance in pips, and a highlighted PRICE row in between. You can see at a glance how much room there is to the next level.
OHLC status
Three short lines describe the current position:
- price against today’s open and this week’s open;
- price against yesterday’s range: inside it (with %), above the high or below the low;
- the levels price is between, or “AT” a level when price is touching it.
Candle fuel
Shows how much of a normal range the bigger candle has already used compared with how much of its time has passed, labelled FAST, SLOW, STRETCHED or NORMAL. When you hover over it, you also see when that candle usually makes its high and low.
Alerts
- Alignment alert when all bigger candles point the same way. It is checked on candle close, never on every tick.
- Optional alert when a candle closes across a pivot level.
- Optional alert when the bigger candle reaches its full average range.
- Popup, sound and push notifications.
Comfort
- Automatic light or dark panel to match your chart.
- Minimise button, remembered separately for each chart.
- Spread and the next-bar timer are shown in the panel.
- Room on the right side of the chart is made automatically and restored when the indicator is removed.
- Light on resources, with no repainting and no signals that change afterwards.