Setup Reality Check
- Indicators
- Version: 1.0
- Activations: 5

Setup Reality Check is a learning indicator. It does not tell you when to buy or sell: it explains what is on your chart, why traders watch it, and how it went every previous time on that same chart.
The reality check
The indicator watches four classic setups: Asian range break, retest of yesterday's high or low, price stretched from VWAP in a range, pullback to the EMA in a trend.
- When one appears, the Cues tab shows a study card: what is happening, why traders care, what would invalidate it.
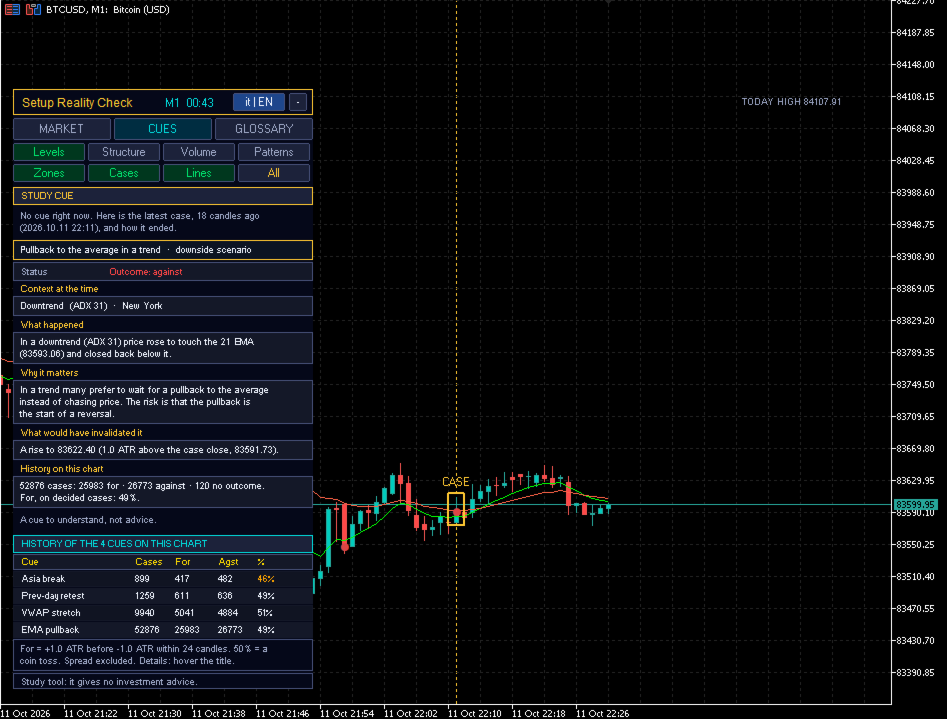
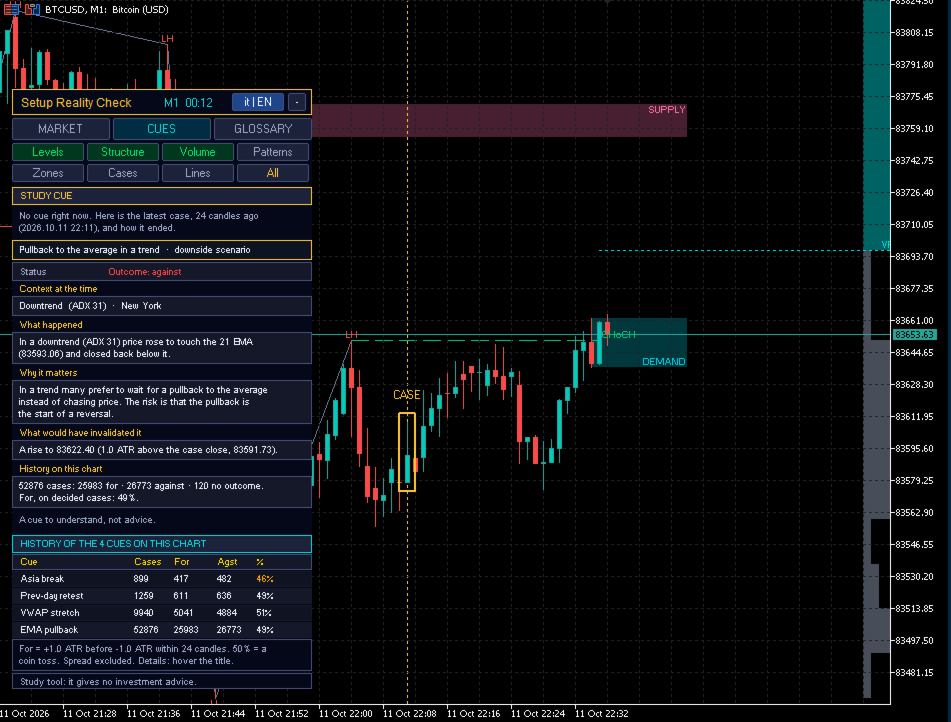
- When none is active, it shows the latest past case and how it ended. A gold box marks that candle on the chart.
- A table shows the history of all four setups on your chart: cases, for, against, percentage.
The measurement is fixed and symmetric: +1 ATR before -1 ATR, within 24 candles. 50% means no edge, like tossing a coin. Spread is not included. A result is highlighted only if it is both unlikely to be chance and at least 3 points away from 50%.
In our tests on M5 charts of BTC, gold and oil, all four setups came out between 44% and 52%. That is the point of the tool: check on your own chart whether a setup you were taught really works, before risking money on it.
What else it shows
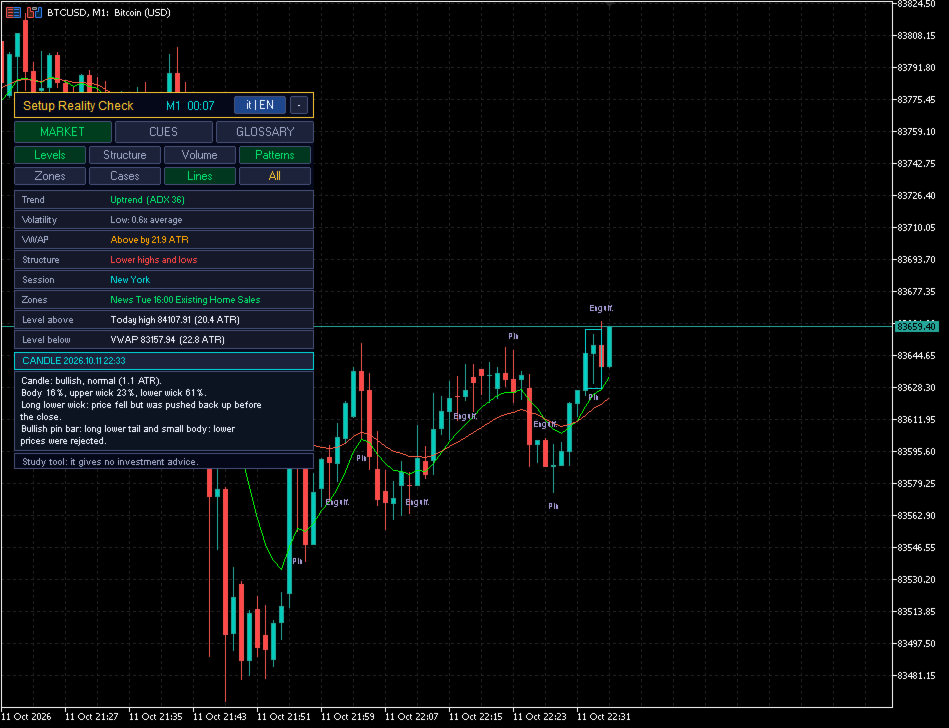
- Market tab: trend (ADX + EMA), volatility versus its recent average, distance from VWAP, market structure, session, news and rollover zones, nearest visible level above and below.
- Candle explained: hover any candle and the panel describes it in plain words: body, wicks, size versus ATR and the pattern it forms. A blue box marks the candle being described.
- Levels with explanations: today's, yesterday's and last week's high/low, Asian range, round numbers, pivots, VWAP, volume profile (POC, VAH, VAL), structure (HH/HL/LH/LL, BOS, CHoCH, demand/supply zones). Every element explains itself on mouse hover.
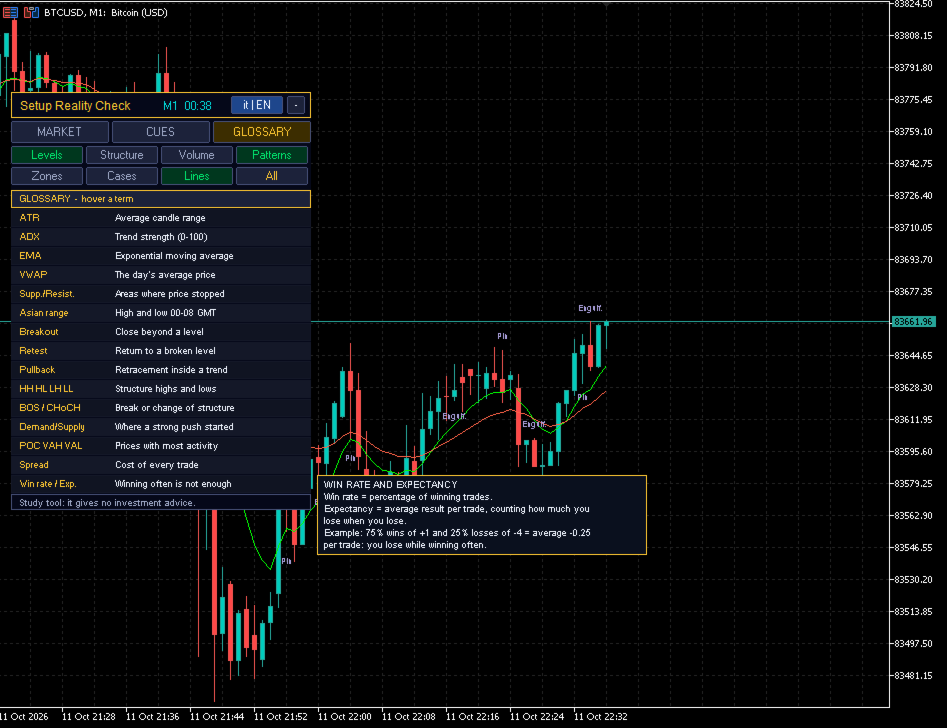
- Glossary tab: 15 key terms, from ATR to win rate versus expectancy.
- Clean chart: one button per layer (levels, structure, volume, patterns, zones, past cases, lines). By default only levels and lines are shown. The panel can be collapsed.
- English / Italian with one click.
What it is not
- It does not open trades and gives no buy or sell signals.
- It does not promise profits. Past results do not guarantee future results.
Notes
- Works on any symbol. Study cues work on timeframes up to H1.
- Volume tools use the broker's tick volume, not exchange volume.
- News zones use the MetaTrader 5 economic calendar, which is not available in the Strategy Tester.
- In the Strategy Tester, button clicks and mouse hover are not available: use the inputs "Starting tab" and "Chart layers at start".
- MetaTrader mobile does not run custom indicators.
Inputs
- Language: Auto (terminal language), Italian or English.
- Chart layers at start: levels, structure, volume profile, patterns, zones, past cases, lines.
- Averages: fast EMA (9), slow EMA (21), ATR period (14), ADX period (14), ADX for trend (25), ADX for range (20).
- Levels: today's, previous day's and previous week's high/low, Asian range, daily pivots, round numbers (step 0 = automatic).
- Zones: rollover window, high-impact USD news window (minutes before/after), days of zones drawn.
- Structure: confirmation bars (0 = automatic), bars analysed, swing line, swing labels, BOS/CHoCH, demand/supply zones per side.
- Volume profile: bars, price bins, width, offset, value area %.
- Candles: explain the candle under the mouse, pattern labels, recent bars to label.
- Study cues: each of the four setups on/off, measurement distance in ATR (1.0), maximum candles for the outcome (24), how long a cue stays on the panel (6 candles), VWAP distance (2.0 ATR), end of the Asian-break window (GMT), past cases shown (400 bars).
- Panel: show panel, starting tab, position on the chart.