JT360 PBO Template
- Indicators
- Version: 2.71
- Updated: 11 October 2026
- Activations: 5

Product Overview
The JT360 DNA PBO Template is a versatile chart analysis tool for MetaTrader 5. It combines multiple candle display modes, six configurable moving averages, Daily/Weekly/Monthly VWAP, and a visual PBO status display in one integrated indicator.
The goal is to provide a flexible chart environment that can be adapted to different trading styles and analysis approaches, from short-term intraday trading to broader trend observation.
Instead of configuring multiple individual indicators separately, users can access key analysis functions and convenient on-chart quick toggles from one interface.
1. Three Candle Modes in One Indicator
Switch between three chart display modes directly from an on-chart button:
-
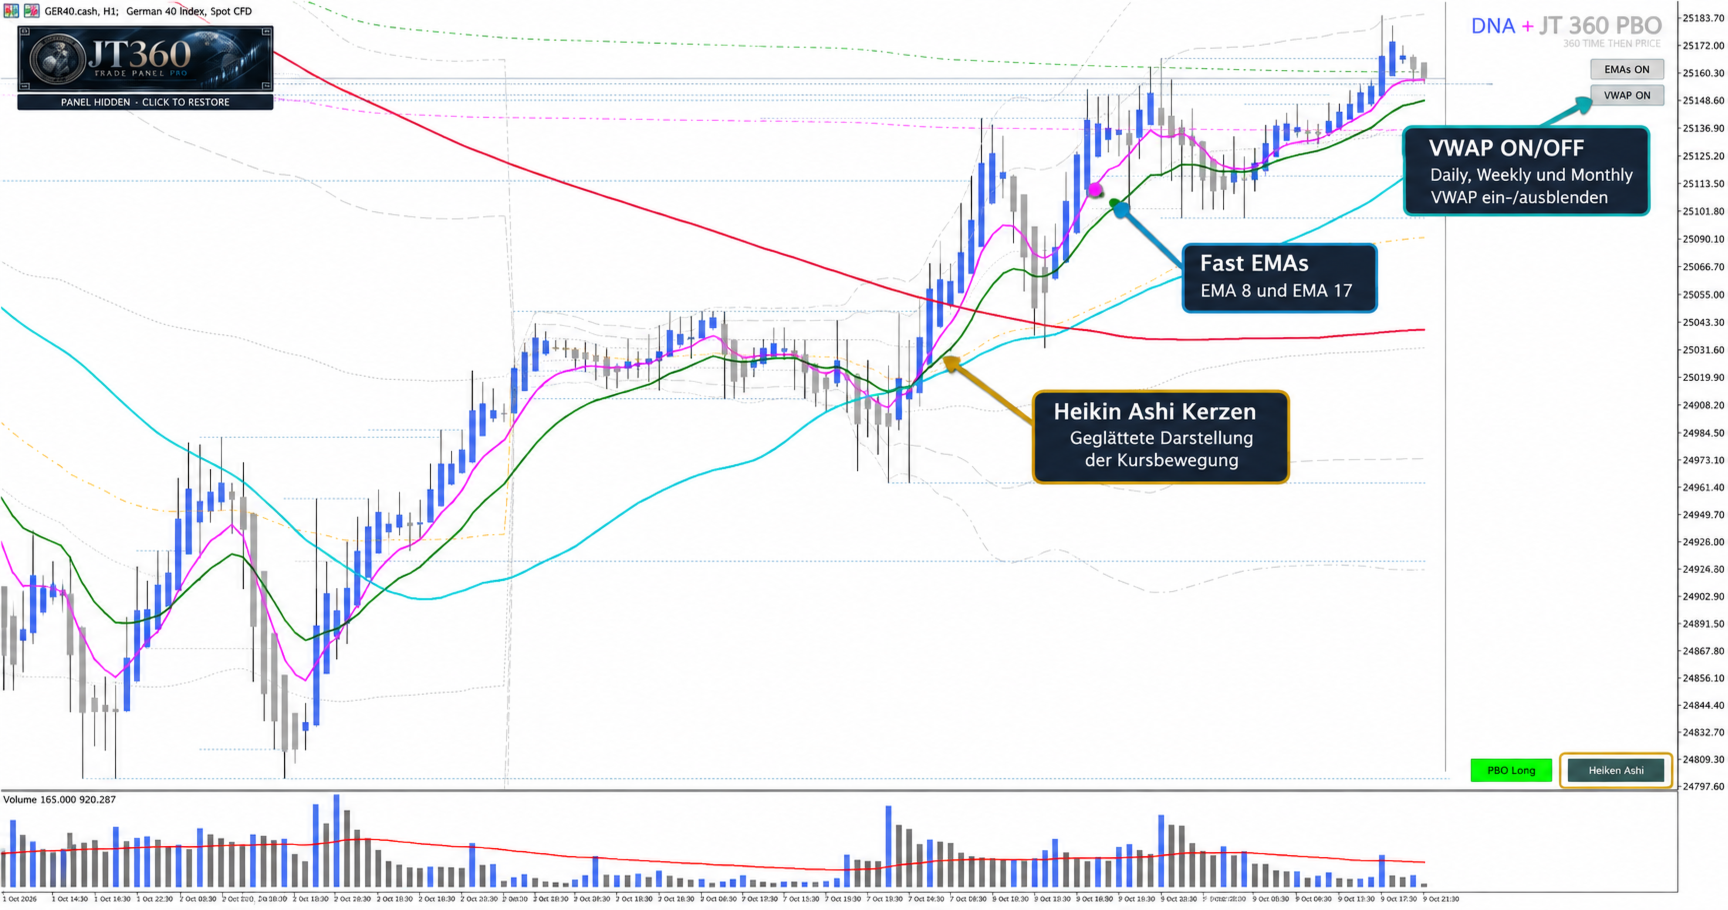
Heikin Ashi: Smooths the visual representation of price movement and helps identify potential trend phases.
-
Standard Candlesticks: Traditional candlesticks based on actual OHLC prices.
-
Heikin Ashi Block: A compact block-style representation based on Heikin Ashi calculations, displaying candle bodies as colored blocks.
Bullish and bearish colors, along with various display parameters, can be configured to suit individual preferences.
2. Six Configurable Moving Averages
The indicator supports up to six independently configurable moving averages.
Available settings include:
-
Individual activation and deactivation
-
Custom periods
-
Calculation methods, including EMA, SMA, and other moving-average methods supported by MetaTrader 5
-
Price source selection
-
Line color and width
The default configuration includes:
-
EMA 8
-
EMA 17
-
SMA 20
-
SMA 50
-
SMA 200
-
SMA 800
This combination allows traders to observe short-term price movement alongside longer-term trend structures. The settings can be adapted to different trading approaches.
Quick Toggle for Fast Moving Averages
The first two moving averages can be shown or hidden together using a dedicated EMA quick-toggle button. This allows traders to simplify or expand the chart display without opening the indicator settings.
3. Integrated VWAP System
The JT360 DNA PBO Template includes three VWAP calculations for different time periods:
-
Daily VWAP: Volume-weighted average price for the current trading day
-
Weekly VWAP: Volume-weighted average price for the current week
-
Monthly VWAP: Volume-weighted average price for the current month
The Daily VWAP is complemented by three configurable standard-deviation levels:
-
±1 standard deviation
-
±2 standard deviations
-
±3 standard deviations
The VWAP lines and deviation bands can be configured individually. Line color, style, and width are adjustable, and the standard-deviation multipliers can also be customized.
VWAP Quick Toggle
A dedicated button allows users to show or hide the VWAP display with one click. This includes the Daily, Weekly, and Monthly VWAP lines, together with the associated Daily standard-deviation bands.
Tick volume is used by default. Real volume can be selected where supported by the available market data.
4. Visual PBO Status with Alert and Background Functions
The integrated PBO status display shows the current moving-average configuration directly on the chart, providing an additional visual reference for market analysis.
Three status states are available:
-
PBO Long: The first two moving averages are above the third moving average.
-
PBO Short: The first two moving averages are below the third moving average.
-
PBO Neutral: The conditions for a clear Long or Short status are not met.
Additional Visual and Alert Signaling
The PBO status can be highlighted through several visual and alert features:
-
Color-coded status display: The status button changes its appearance according to the current Long, Short, or Neutral state.
-
Chart background color change: When the PBO Long state is active, the chart background can automatically change to a predefined color. When the Long state ends, the previously stored background color is restored.
-
Popup alerts: Status changes can optionally be signaled through popup notifications.
These features help traders recognize relevant changes in the moving-average configuration without having to monitor every chart detail continuously.
The PBO display is a configurable analysis aid. It does not guarantee future price movement and does not place trades automatically.
5. Candle Timer
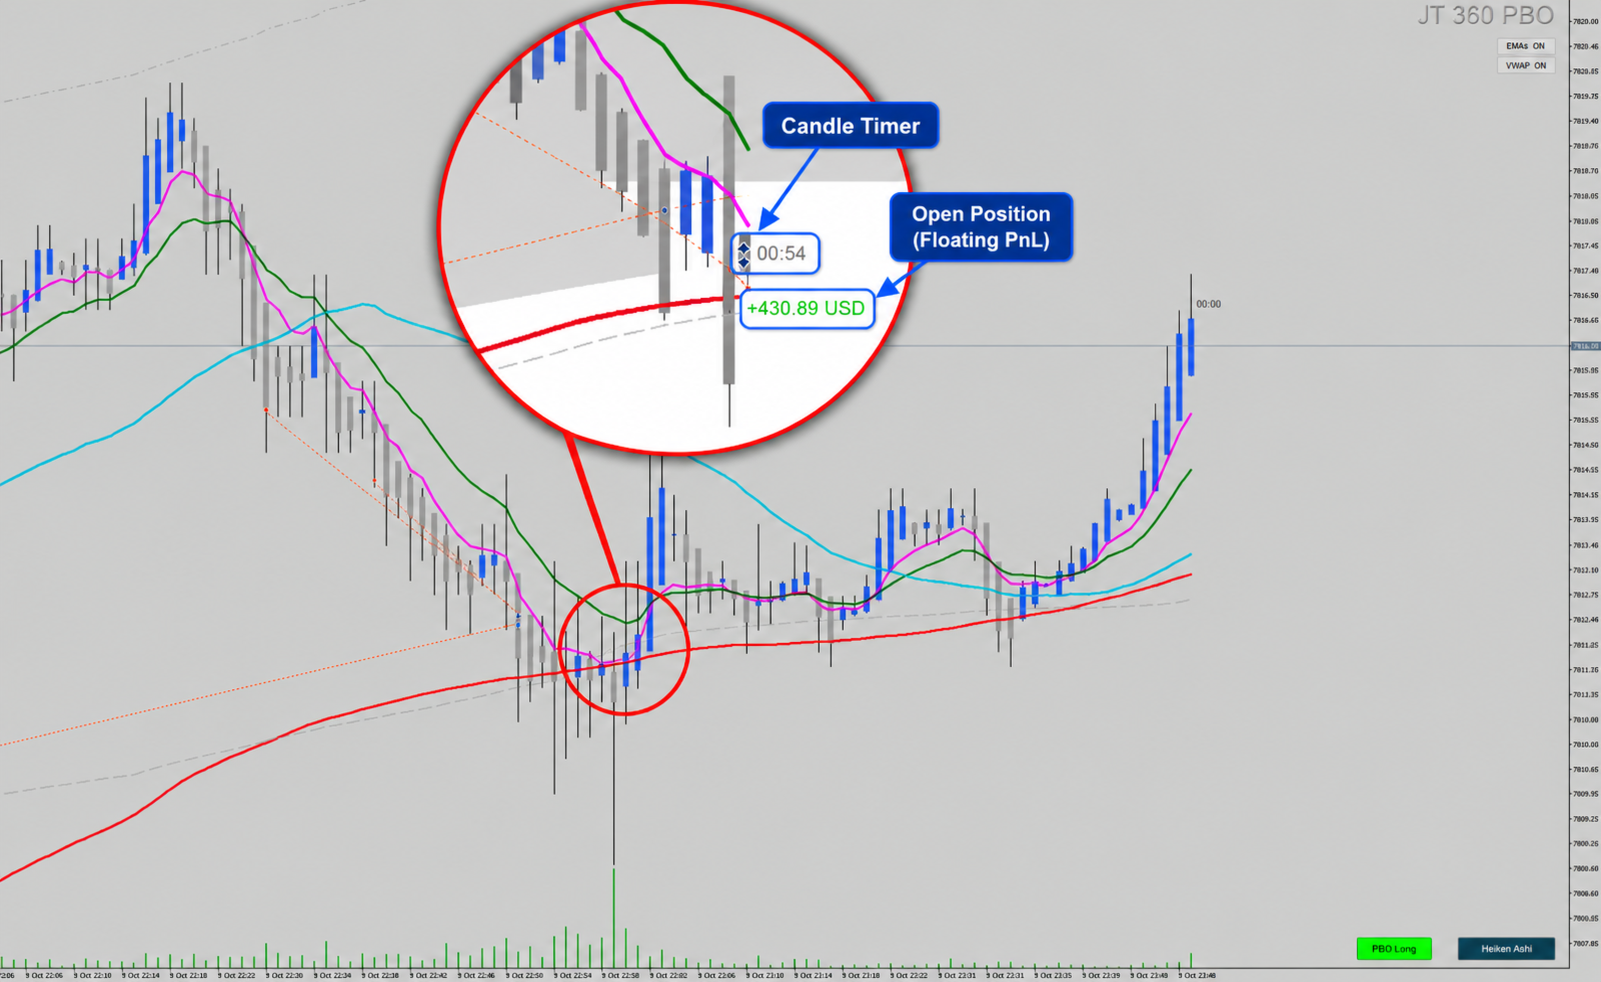
An integrated candle timer displays the remaining time of the current candle directly on the chart.
The display updates continuously and can be customized, including font, font size, color, and distance from the candle.
This feature helps traders keep track of the time remaining before the current candle closes.
6. Floating P/L Display
The template can display the current floating profit or loss of open positions for the symbol shown on the chart.
The calculation takes profit or loss and swap into account. Positive and negative values can be displayed in different colors. Font size, font type, and display offset are configurable.
This feature provides a quick visual reference and is not intended to replace a complete account balance or risk report.
7. Convenient On-Chart Controls
The JT360 DNA PBO Template combines its analysis functions with direct on-chart controls:
-
Switch between Heikin Ashi, Standard Candlesticks, and Heikin Ashi Block
-
Quickly show or hide the two fast moving averages
-
Quickly show or hide the VWAP system
-
View the PBO status with optional popup alerts and chart background color changes
-
Display the candle timer and optional floating P/L
Colors, line settings, calculation methods, and display parameters can be adjusted to create a personalized chart layout.
Who Is This Template For?
The JT360 DNA PBO Template is designed for traders who want to organize their chart analysis and combine multiple chart display modes and analytical tools in one indicator.
It is particularly suitable for traders who want to:
-
Switch between traditional candlesticks and alternative candle representations
-
Combine short-term and long-term moving averages
-
Use Daily, Weekly, and Monthly VWAP
-
Monitor Daily VWAP standard-deviation bands
-
Use a visual PBO status display with optional alerts
-
Quickly adapt their chart layout to different analysis situations
Important Information
The JT360 DNA PBO Template is a chart indicator for MetaTrader 5. It does not place orders or automatically manage trading positions.
Displayed values and status information are analytical aids. They do not constitute investment advice or guarantee profitable trading decisions. The accuracy and usefulness of calculations depend, among other factors, on the price and volume data provided by the broker.
JT360 DNA PBO Template – Flexible Chart Display. Structured Analysis. Direct Control on the Chart.