JT360 PBO Template

JT360 DNA PBO Template V2.7 Public – Multi-Mode Chart Analysis for MetaTrader 5

Product Overview

The JT360 DNA PBO Template is a versatile chart analysis tool for MetaTrader 5. It combines multiple candle display modes, six configurable moving averages, Daily/Weekly/Monthly VWAP, and a visual PBO status display in one integrated indicator.

The goal is to provide a flexible chart environment that can be adapted to different trading styles and analysis approaches, from short-term intraday trading to broader trend observation.

Instead of configuring multiple individual indicators separately, users can access key analysis functions and convenient on-chart quick toggles from one interface.

1. Three Candle Modes in One Indicator

Switch between three chart display modes directly from an on-chart button:

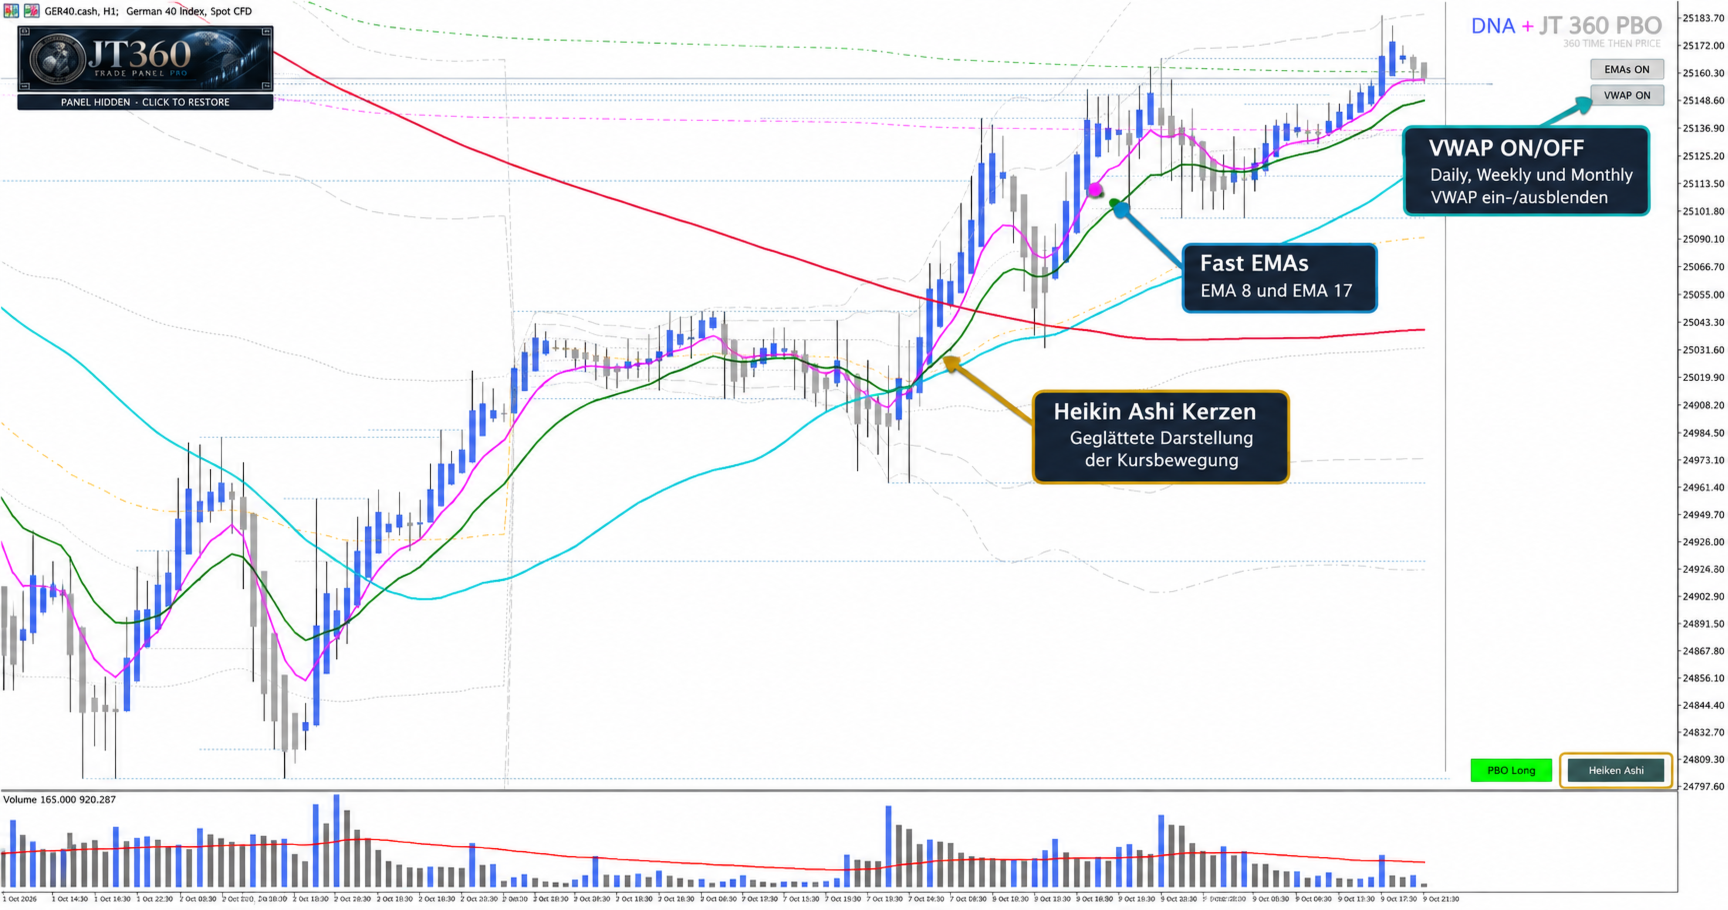
  • Heikin Ashi: Smooths the visual representation of price movement and helps identify potential trend phases.

  • Standard Candlesticks: Traditional candlesticks based on actual OHLC prices.

  • Heikin Ashi Block: A compact block-style representation based on Heikin Ashi calculations, displaying candle bodies as colored blocks.

Bullish and bearish colors, along with various display parameters, can be configured to suit individual preferences.

2. Six Configurable Moving Averages

The indicator supports up to six independently configurable moving averages.

Available settings include:

  • Individual activation and deactivation

  • Custom periods

  • Calculation methods, including EMA, SMA, and other moving-average methods supported by MetaTrader 5

  • Price source selection

  • Line color and width

The default configuration includes:

  • EMA 8

  • EMA 17

  • SMA 20

  • SMA 50

  • SMA 200

  • SMA 800

This combination allows traders to observe short-term price movement alongside longer-term trend structures. The settings can be adapted to different trading approaches.

Quick Toggle for Fast Moving Averages

The first two moving averages can be shown or hidden together using a dedicated EMA quick-toggle button. This allows traders to simplify or expand the chart display without opening the indicator settings.

3. Integrated VWAP System

The JT360 DNA PBO Template includes three VWAP calculations for different time periods:

  • Daily VWAP: Volume-weighted average price for the current trading day

  • Weekly VWAP: Volume-weighted average price for the current week

  • Monthly VWAP: Volume-weighted average price for the current month

The Daily VWAP is complemented by three configurable standard-deviation levels:

  • ±1 standard deviation

  • ±2 standard deviations

  • ±3 standard deviations

The VWAP lines and deviation bands can be configured individually. Line color, style, and width are adjustable, and the standard-deviation multipliers can also be customized.

VWAP Quick Toggle

A dedicated button allows users to show or hide the VWAP display with one click. This includes the Daily, Weekly, and Monthly VWAP lines, together with the associated Daily standard-deviation bands.

Tick volume is used by default. Real volume can be selected where supported by the available market data.

4. Visual PBO Status with Alert and Background Functions

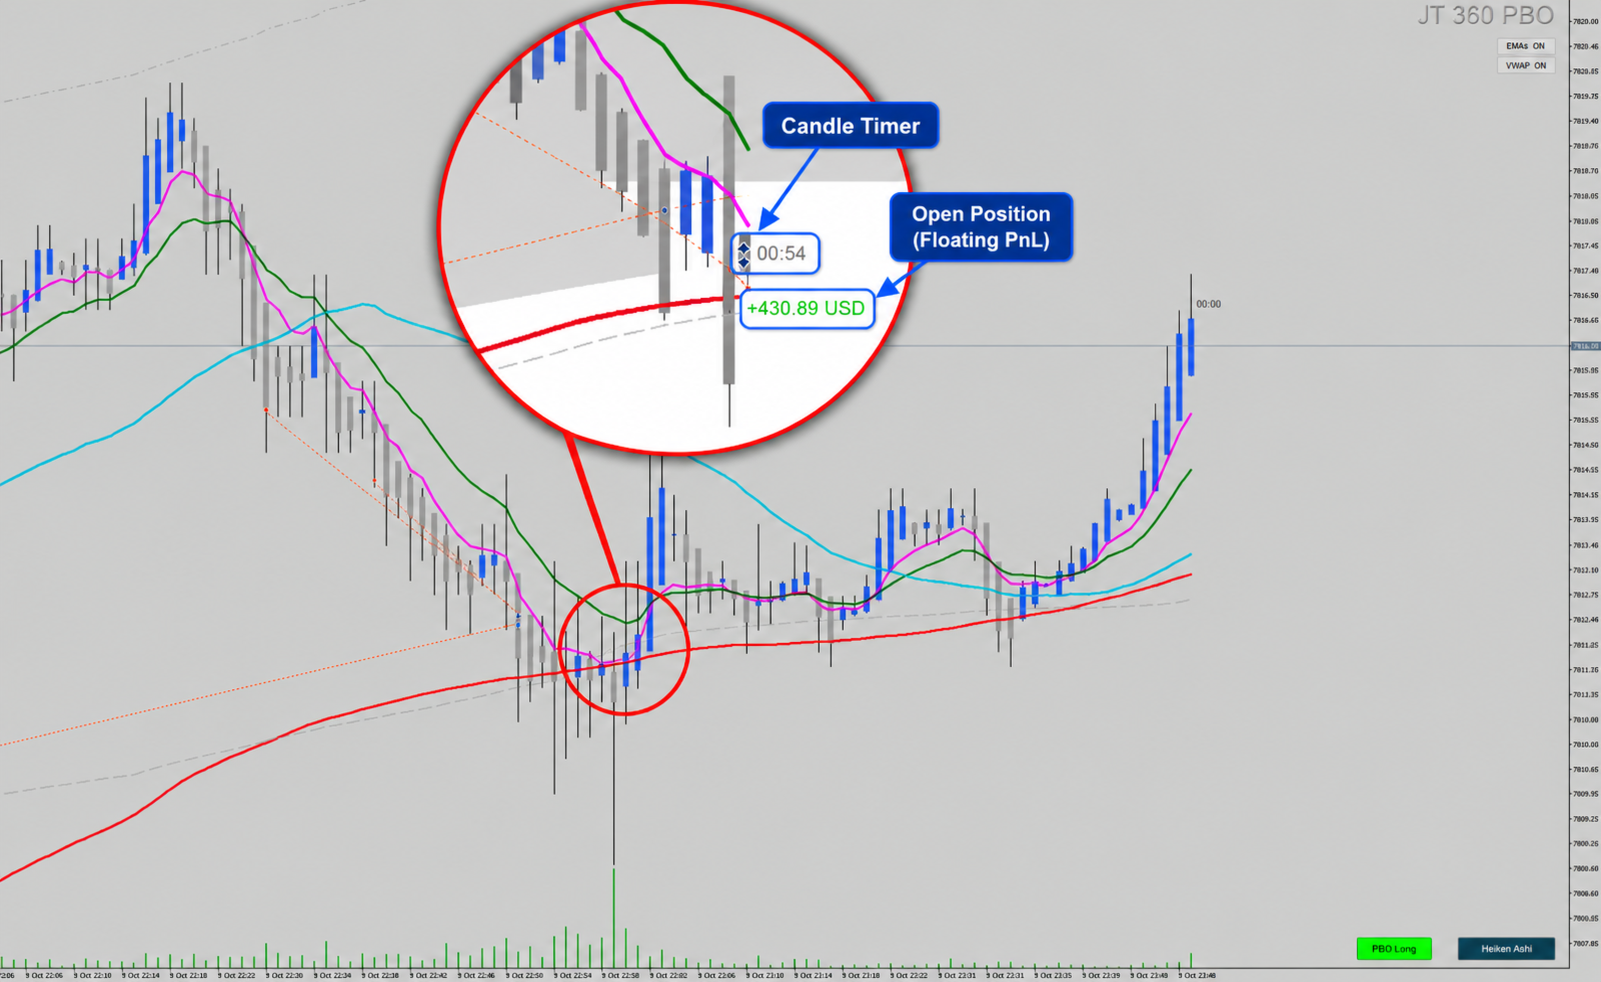
The integrated PBO status display shows the current moving-average configuration directly on the chart, providing an additional visual reference for market analysis.

Three status states are available:

  • PBO Long: The first two moving averages are above the third moving average.

  • PBO Short: The first two moving averages are below the third moving average.

  • PBO Neutral: The conditions for a clear Long or Short status are not met.

Additional Visual and Alert Signaling

The PBO status can be highlighted through several visual and alert features:

  • Color-coded status display: The status button changes its appearance according to the current Long, Short, or Neutral state.

  • Chart background color change: When the PBO Long state is active, the chart background can automatically change to a predefined color. When the Long state ends, the previously stored background color is restored.

  • Popup alerts: Status changes can optionally be signaled through popup notifications.

These features help traders recognize relevant changes in the moving-average configuration without having to monitor every chart detail continuously.

The PBO display is a configurable analysis aid. It does not guarantee future price movement and does not place trades automatically.

5. Candle Timer

An integrated candle timer displays the remaining time of the current candle directly on the chart.

The display updates continuously and can be customized, including font, font size, color, and distance from the candle.

This feature helps traders keep track of the time remaining before the current candle closes.

6. Floating P/L Display

The template can display the current floating profit or loss of open positions for the symbol shown on the chart.

The calculation takes profit or loss and swap into account. Positive and negative values can be displayed in different colors. Font size, font type, and display offset are configurable.

This feature provides a quick visual reference and is not intended to replace a complete account balance or risk report.

7. Convenient On-Chart Controls

The JT360 DNA PBO Template combines its analysis functions with direct on-chart controls:

  • Switch between Heikin Ashi, Standard Candlesticks, and Heikin Ashi Block

  • Quickly show or hide the two fast moving averages

  • Quickly show or hide the VWAP system

  • View the PBO status with optional popup alerts and chart background color changes

  • Display the candle timer and optional floating P/L

Colors, line settings, calculation methods, and display parameters can be adjusted to create a personalized chart layout.

Who Is This Template For?

The JT360 DNA PBO Template is designed for traders who want to organize their chart analysis and combine multiple chart display modes and analytical tools in one indicator.

It is particularly suitable for traders who want to:

  • Switch between traditional candlesticks and alternative candle representations

  • Combine short-term and long-term moving averages

  • Use Daily, Weekly, and Monthly VWAP

  • Monitor Daily VWAP standard-deviation bands

  • Use a visual PBO status display with optional alerts

  • Quickly adapt their chart layout to different analysis situations

Important Information

The JT360 DNA PBO Template is a chart indicator for MetaTrader 5. It does not place orders or automatically manage trading positions.

Displayed values and status information are analytical aids. They do not constitute investment advice or guarantee profitable trading decisions. The accuracy and usefulness of calculations depend, among other factors, on the price and volume data provided by the broker.

JT360 DNA PBO Template – Flexible Chart Display. Structured Analysis. Direct Control on the Chart.

おすすめのプロダクト
Pivot Prof
Paul Anscombe
4.91 (35)
Ulimate MTF Support & Resistance - 5 Star Best Seller  New Year Sale - save $20    (normal price $79) Beginner or Professional our best selling multi-timeframe Pivot Prof will enhance your trading and bring you great trade opportunities with the Support and Resistance levels that professionals use. Pivot trading is a simple effective method for entering and exiting the market at key levels and has been used by professionals for decades and works on all symbols: Forex, Crypto, Stocks, Indicies et
Multi Chart Synchronizer: 究極のマルチチャート同期装置  Multi Chart Synchronizer は、マルチタイムフレーム分析とヒストリカルバックテストを効率化するために設計されたプロフェッショナルグレードの同期ツールです。チャートを手動で調整する手間が省けるため、プライスアクションと戦略策定に集中できます。 主なメリット 履歴バックテストに最適化:   過去の市場データを分析して優位性を高めるトレーダーに最適です。 シームレスなMTF分析:   同じ銘柄の複数のチャートを瞬時に同期します。上位時間枠でトレンドの成立を特定すると、キーを1回押すだけで、下位時間枠のチャートもすべてその瞬間に合わせて同期されます。 多用途アプリケーション:   複数の時間枠にわたってエントリー条件を確認する必要がある裁量トレーダーと EA 開発者の両方にとって不可欠なツールです。 主な特徴 インスタント同期(Qキー):   特定のローソク足にマウスを移動し、   「Q」   キーを押すだけです。その瞬間、同じ銘柄の開いているすべてのチャートに垂直同期ラインが表示されます
Currency Strength & Pair Selection Dashboard is a MetaTrader 5 indicator for manual FX analysis. It ranks eight major currencies — USD, EUR, GBP, JPY, CHF, CAD, AUD, and NZD — using closed-bar relative returns from available broker currency pairs. Multi-timeframe analysis (configurable 1–4 timeframes) shows trend, momentum, and MTF agreement for each currency. The pair-selection table ranks candidate pairs by currency-strength difference and labels alignment as Strong, Moderate, Neutral, or Mixe
The   Correlation Matrix   indicator shows the actual correlation between the selected instruments. The default setting is set to 28 currency pairs, gold, and silver, but the indicator can compare any other symbols. Interpretation of the indicator Positive correlation  (correlation is above 80 %). Negative correlation  (correlation is below -80 %). Weak or no correlation  (correlation is between -80 and 80 %). Main features The indicator shows the actual correlation between the selected instr
Dual Striker - ゴールド取引向けの新しいEAです。 ライブシグナル +150% ->   リアル口座 マーチンゲールなし、ナンピンなし お使いの取引プラットフォームで無料テスト:   Dual Striker EA ほとんどのトレーダーは ZigZag を誤って使用しています。 それは市場理解を助けるどころか、誤ったシグナルを生み、トレンドの認識を歪めます。 Valable ZigZag はこの問題を解決します 。価格の動きの本質的な構造と市場の方向を示します。 従来の ZigZag の限界 従来の ZigZag は過剰に多くの動きに反応します。 その結果: 小さな押し目でも大きな変化のように見える レベルのブレイクがシグナルとして認識されるが、継続しない 調整と本当のトレンド転換の区別が難しくなる これにより不要な行動が増え、現在の市場の動きを正しく理解できなくなります。 VALABLE ZIGZAG がトレンドを定義する仕組み 以下はインジケーターの仕組みの簡単な説明です。チャート上で方向がどのように形成されるかを理解する助けになります。 Valable Zi
FREE
親愛なるフォレックストレーダーの皆様へ、 私たちのトレーディングの旅路において重要な役割を果たしてきたGoldenCeresインジケーターをご紹介することを大変嬉しく思います。私の親友と私は、このインジケーターを使ってフォレックス市場を成功裏に航行してきました。そして今、私たちはそれをMQL5コミュニティと共有することを熱望しています。 GoldenCeresは、フォレックス取引の経験があるトレーダー向けに設計された直感的でユーザーフレンドリーなインジケーターです。それはチャート上で明確な買いまたは売りのシグナルを提供し、意思決定プロセスを簡素化します。さらに、チャート上の小さな紫色の線として表される推奨TakeProfitレベルを提供します。この推奨レベルの精度は、私たちが「Risk Level」と名付けた入力変数を使用してカスタマイズすることができます。 「Risk Level」変数は1から20の範囲です。値が1の場合、TakeProfitレベルを高確率でヒットする保守的な戦略を示しますが、報酬は比較的小さいです。値が10の場合、TakeProfitレベルを良好な確率でヒットし、適
LSB Indicator (Liquidity Structure Break Out) Professional Multi-Timeframe Trading Tool Product Overview The LSB (Liquidity Structure Break Out) indicator is a sophisticated structural trading tool designed to identify critical liquidity zones across multiple timeframes. By analyzing the interplay between market structure and liquidity, it provides high-probability breakout signals and precise entry triggers, specifically optimized for scalping and day trading on the 1-minute timeframe.
EUR/USD Trade Plan Assistant Manual EUR/USD entry and risk-planning indicator for MetaTrader 5. It displays confirmed trade plans with entry, stop, target, position volume, time limit and combined account risk in a clear chart interface. Product description EUR/USD Trade Plan Assistant is designed for traders who want structured EUR/USD trade plans without automatic order execution. The indicator continuously evaluates EUR/USD and can display up to three independent trade plans based on differen
A tool for creating Bill Williams indicators Our tool provides the ability to set Bill Williams indicators on a chart with a mouse click. - The Awesome Oscillator (AO) indicator helps to assess the driving force of the trend. - Alligator indicator — determines the current state of the trend and possible entry and exit points. - Fractals indicator — helps to identify significant levels  - Accelerator Oscillator (AC) indicator — shows the change in trend acceleration. - Market Facilitation Index
FREE
Trading Rules Enforcer is a deterministic account-discipline monitor for trade-count, loss, time and exposure rules. Key functions: - Clear rule status dashboard - Trading-session restrictions - Overtrading controls - Symbol and Magic Number scope - Daily loss and exposure monitoring - Clear blocking reasons - Operational event history The utility enforces rules configured by the user. It does not generate entry signals, predict market direction or guarantee trading results. Test all rule comb
Big Figure Indicator MT5
Vonjinirina Alfred Randrianiaina
「BIG FIGURE INDICATOR」は、価格チャート上で整数や半分の数字(たとえば、通貨取引での1.0000や1.5000など)など特定のレベルで自動的に水平線を識別して描画します。これらのレベルは心理的に重要であると考えられており、大口トレーダーや投資家が注目する可能性がある丸められた数字を表しており、潜在的なサポートまたはレジスタンスレベルにつながります。ビッグフィギュアインジケーターは、トレーダーが重要な価格レベルを特定し、これらのレベルに基づいて取引決定を行うのに役立ちます。 ラインはM1からH8のタイムフレームチャートにのみ表示されます。 ラインの色は入力パラメータタブで変更できます。 すべての通貨ペアで使用できます。 MT4バージョン: https://www.mql5.com/fr/market/product/96747 注意:当社のインジケーターを最適に機能させるには、まずデイリー(D1)タイムフレームを読み込む必要があります
Currency Strength Monitor is a professional multi-currency strength indicator for MetaTrader 5 that analyzes and displays the relative strength of 8 major currencies (USD, EUR, GBP, AUD, NZD, JPY, CHF, CAD) in real-time. The indicator calculates strength values by aggregating price movements across 28 currency pairs and normalizing them using ATR, providing traders with a clear visual representation of which currencies are strengthening or weakening. Key Features: Multi-Currency Analysis — Monit
CapitalSol Forex MTF Scanner Multi-Timeframe Forex Trend Scanner for MetaTrader 5 CapitalSol Forex MTF Scanner is a multi-symbol and multi-timeframe market analysis indicator designed to provide a structured overview of Forex market direction directly inside MetaTrader 5. Instead of opening and checking multiple currency charts individually, the scanner displays the selected Forex pairs in one compact dashboard and evaluates their directional state across several timeframes simultaneously.
Speed Alert is a professional volatility-based indicator designed to detect fast market movements and high-speed candles in real-time. When the market suddenly accelerates and a candle moves with abnormal speed compared to recent price action, Speed Alert instantly notifies the trader. The indicator continuously analyzes recent candles to calculate the average price speed. When the current candle exceeds the defined speed threshold, it indicates strong momentum and increased volatility, which
SMT Divergence Multi Pair compares the swing highs and swing lows of the chart symbol with up to two correlated symbols and marks where they disagree. This is the Smart Money Technique (SMT) divergence used in ICT and Smart Money Concepts trading: one market sweeps a previous high or low while its correlated market fails to confirm the move. Discount Ends Soon — Next Price: $99 HOW IT WORKS The indicator finds confirmed swing highs and lows on the chart symbol and compares each new swing with th
Anan Smart Flow Pro is a premium MT5 signal indicator designed for traders who prefer structured entries, clean visual execution zones, and confirmed closed-candle signals. The indicator combines smart trend-following logic with ATR-based dynamic TP/SL levels to provide professional BUY and SELL opportunities directly on the chart. Signals are confirmed only after candle close and do not repaint on closed candles. Main Features: • Non-repainting closed-candle signals • Smart BUY / SELL entr
Gamma Volatility Levels
Carlos Pascual Perez Maturano
Gamma & Volatility Levels Pro [XAUUSD Edition] – The indicator used by professional gold traders in 2025 Fully automatic indicator developed exclusively for XAUUSD (Gold). Displays in real time the most powerful institutional levels that move gold price every single day: • HVL (High Volatility Level) – Orange dashed line Dynamic extreme volatility level (20-period SMA + 1 standard deviation). Gold bounces or breaks this level 87 % of sessions with moves of +$40 to +$120. • CALL RESISTANCE – Blue
Pre-Purchase Notice:   This indicator performs best on zero-spread accounts or fixed-spread accounts — i.e., broker accounts that do not widen spreads during news events. Prefer to use the Exness Zero-spread account. DeltaVolumeBubble — Volume Bubble Indicator A visualization tool distilled from Order Flow Delta. Using   bubble size × color , it lets you instantly read the true bull-bear battle behind every single candlestick. What Problem Does This Indicator Solve? Price can deceive you, bu
Knowledge of the strength and weakness of each currency is vital for every forex trader. Our   Currency Strength Meter indicator   measures the strength of eight major currencies (USD, EUR, GBP, CHF, JPY, CAD, AUD, NZD) by using the Relative Strength Index indicator, also known as RSI. The Currency Strength Meter indicator shows you, simply and quickly, when a currency is oversold, overbought, or in "normal area". This way, you can identify which currency is the strongest and the weakest. Our
マルチタイムフレームRSIインジケーター 直感的なRSIインジケーターでマルチタイムフレーム分析の力を解き放ちましょう! 単一のチャート上で、さまざまな時間枠における市場の勢いを包括的に把握できます。当社のマルチタイムフレームRSIインジケーターを使用すると、5つのカスタマイズ可能な時間枠で一貫した期間で相対力指数(RSI)を追跡でき、より情報に基づいた取引決定を下すことができます。 主な機能: 同時マルチタイムフレーム表示: 最大5つの異なる時間枠のRSIを単一のチャートで同時に監視でき、ウィンドウを切り替える必要がありません。 カスタマイズ可能な時間枠: M1からMNまで、取引戦略に合わせて好みの時間枠を定義できます。 統一されたRSI期間: 選択したすべての時間枠で一貫したRSI計算期間を維持し、直接比較を可能にします。 明確な視覚表現: 複数の市場サイクルにおける買われすぎ/売られすぎの状況と勢いの変化を簡単に識別できます。 強化された意思決定: 時間枠間のダイバージェンスとコンバージェンスを発見し、市場トレンドに関するより深い洞察を提供します。 ユーザーフレンドリーなインター
Pip Movement Alert MT5で市場のモメンタムを先取りしましょう。この多通貨対応の汎用インジケーターは、複数のシンボルにおける正確なピップの動きを追跡し、トレーダーにアラートを提供するために設計されており、外国為替、株式、暗号通貨、商品取引に最適です。Forex FactoryやRedditのr/Forexなどのトレーディングコミュニティで称賛され、InvestopediaやTradingViewの議論でも急激な市場変動を検出する能力で注目されており、価格の急激な変動を活用しようとするトレーダーにとって必須のツールです。ユーザーは、ピップベースの重要な動き(例:10ピップ単位)を最大95%の信頼性で特定し、リアルタイムアラートを活用してボラティリティの急上昇を捉えることで、取引タイミングが20-30%改善したと報告しています。主な利点には、多通貨モニタリング、カスタマイズ可能なピップ閾値、チャートを常に分析せずに追跡を簡素化する軽量デザインが含まれ、スカルパー、デイトレーダー、スイングトレーダーに最適です。 Pip Movement Alert MT5は、ユーザー定義の
FREE
概要 MT5向けのマルチ銘柄・マルチ時間足モニターです。テキストで条件を定義すると、スクリーナーが連続してスキャンし、銘柄が条件を満たした時点でポップアップ・サウンド・プッシュ通知でお知らせします。 説明 Custom Screener は、価格、移動平均、RSI、ストキャスティクス、ローソク足パターンに基づく条件で複数の銘柄と時間足をスキャンします。結果は並べ替え可能な表で表示され、ワンクリックでチャートを開けます。 連続スキャン。 既定ではスキャンが終わっても停止しません。次のローソク足の開始に合わせてサイクルが自動的に再開し、表はその場で更新されます。従来どおり1クリックにつき1回のスキャンを希望する場合は、 scanMode を単発実行に設定してください。 必要なときだけ通知。 ポップアップ、サウンド、スマートフォンへのプッシュはそれぞれ個別に有効化でき、条件を 満たした瞬間 の遷移で発報します。条件が真であり続ける間、スキャンのたびに繰り返すことはありません。同一サイクルの発生分はまとめて1件の通知として届きます。 追加スクリプトなしで複数市場を客観ルールで監視するのに適して
インジケータMTFクリスタリウム矢印は、半自動取引システムであります. これは、すべての通貨ペアで動作します。  インジケータは、三つのルールを使用しています:1)我々は唯一のトレンドで取引、2)"誰もが販売しているときに購入し、誰もが買うときに販売する"、3)価格  インジケータMTF矢印は、内蔵の指標を使用して、複数の時間枠全体のクリスタリウムフィルタルール。 トレンドは、選択した時間間隔で一致した場合、インジケータは、市場に参入するための矢印を与えます。 それからあなた自身の決定をする。 購入する-緑の矢印、売る-赤い矢印。 指標では、ロットを変更したり、EAの取引時間とシャットダウン時間を設定することができます。 また、作業期間と時間フィルタを変更することができます。 ビープ音が鳴ってる  推薦された働く期間D1。 フィルタH1とH4。  設定: TF働く期間(推薦されたD1) Cci_cperiodcomment CCIレベルアップ CCIレベルDn CCI価格 SARステップ SAR最大値 TFのFilter1–(推薦されたH1) TFのFilter2
RFX Forex Strength Meter is a powerful tool to trade 8 major currencies in the Forex market, U.S. Dollar ( USD ) European Euro ( EUR ) British Pound ( GBP ) Swiss Franc ( CHF ) Japanese Yen ( JPY ) Australian Dollar ( AUD ) Canadian Dollar ( CAD ) New Zealand Dollar ( NZD ) The indicator calculates the strength of each major currency using a unique and accurate formula starting at the beginning of each trading day of your broker. Any trading strategy in the Forex market can be greatly improved b
Of all the four principle capital markets, the world of foreign exchange trading is the most complex and most difficult to master, unless of course you have the right tools! The reason for this complexity is not hard to understand. First currencies are traded in pairs. Each position is a judgment of the forces driving two independent markets. If the GBP/USD for example is bullish, is this being driven by strength in the pound, or weakness in the US dollar. Imagine if we had to do the same thing
Logiciel MQL5 – TIME BOX PRO v2.0 概要 TIME BOX PRO v2.0 , MetaTrader 5 Liste des prix ​ Description du produit :  Y EAR(年)、SEMESTRE(半期)、QUARTER(四半期)、MONT H, SEMAINE, JOUR, jour ( HB 90 %, 50 %, 10 %) Logiciel MQL5化されており、全ての重要期間を迅速かつ効率的に確認できます。 主な機能 マルチタイムフレーム : ANNÉE, SEMESTRE, TRIMESTRE, MOIS, SEMAINE, JOUR タイムフレームごとのカラーボックス で価格レンジを視覚化 カスタマイズ可能な HBレベル (90%, 50%, 10%) 動的ラベル により期間を表示 (ANNÉE, S1, Q1, M1, SEMAINE, JOUR) Processeur CPU  : タイムフレームごとの表示/非表示 を入力設定で切替可能 表示期間の制限 で最大のパフォーマンスを確保 Valeurs d
Heatmap Indicator
Ganegama Ganithage Rumesh Erangana
XAUUSD Heat Map Scalping Indicator Perfect for 1M, 3M, 5M, 15M Scalping on Gold (XAUUSD) Take your scalping to the next level with this exclusive Heat Map indicator , designed and optimized specifically for XAUUSD . This tool is a powerful visual assistant that helps you instantly identify market strength, pressure zones, and potential entry points in real time. Key Features: Optimized for Fast Scalping : Works best on 1-minute, 3-minute, 5-minute, and 15-minute timeframes Specializ
This positions risk visualization indicators, indicators allow you to clearly know price go back will be generated how much account Loss Percent.      This is very useful indicator for Controlling Risk when account is open positions, attach this indicator to the chart of the open positions, this indicator will draw three Lines, the three Line of Loss Percent default value is 10% 30% 50% user can define their own Loss Percent value. Loss Percent corresponding Back Point will show in the upper
Contact me after payment to send you the user manual PDF file. Download the MT4 version here. Volume Profile Indicator A functional and useful tool that can improve your trading plan. This indicator calculates volume in price levels(typical volume indicator shows only candle volumes). With the volume of price levels, you can identify important areas that have the potential to reverse. You can also see the volume of support and resistance levels and decide on them. Using volume profiles along
SMC Sweep Fvg MT5 — スマートマネーと同じ目線で、チャート上に市場を映す こんな経験はありませんか。価格がストップを巻き取り、反転し、まさに想定どおりの方向へ進む。方向は正しかった。間違えたのはエントリーだけです。 このインジケーターは、そうした場面を減らすために作られています。分析で最も重い部分——チャートのマークアップ——を引き受け、本当に重要な「判断」をあなたに残します。 チャートに表示されるもの マーケットストラクチャー — 実際の構造的高値・安値に HH / HL / LH / LL ラベルとレベルライン。トレンドが一目で分かり、推測は不要です。 インバランスゾーン(FVG) — 価格が急ぎ過ぎて通過し、後で戻りやすい領域。未埋めと既埋めのゾーンは別色で表示されます。 流動性の動き — 反転前に市場がレベルを巻き取る瞬間を追跡します。 トレード設計の完成形 — エントリー矢印、ストップロス、利益目標。すべて描画済みで、頭の中で計算する必要はありません。 トレンドフィルター — 上位足のラインで、主戦場の動きの側に立ち続けられます。 インジケーターは
このプロダクトを購入した人は以下も購入しています
Neuro Poseidon is a new indicator by Daria Rezueva. It combines precise trading signals with adaptive TP/SL levels - creating best possible trades as a result! Message me and get  Neuro Poseidon Assistant  as a gift to automize your trading process! What makes it stand out? 1. Proven profitability on all assets and timeframes 2. Only confirmed BUY and SELL signals present on the chart 3. Adaptive TP & SL levels generated by the software for each trade 4. Easy to understand - suitable for al
もう勘でトレードしなくていい。 エントリーのタイミング、決済の場所、相場がどちらに傾いているか、そのすべてが1つのチャートで分かります。 RelicusRoad Proは、20種類近くのツールを1つのインジケーターにまとめました。自分のトレードスタイルに合うツールだけをオンにできます。 エントリーは明確に。決済も明確に。すべてのチャートに計画を。 心当たりはありませんか? 買った途端、1分もしないうちに価格が逆行する。 早めに決済してしまい、その後も値動きが続くのを眺めている。 チャートにインジケーターを5つ並べても、答えは5通りある。 ストップロスの位置は、なんとなく決めている。 開発した理由 私たちは18年間、FXを取引してきました。RelicusRoadの中核となるアルゴリズムは、最初は非公開で、私たちプロのトレーダー仲間のために作られました。 きっかけは個人的なものでした。毎回同じラインを手で引き、自分たちで決めたルールを破り、チャート上の重要な一点を見落とすことに、私たちは疲れていたのです。 私たちにとって効いたのは一貫性です。毎日同じ方法で相場を読み続け、それが体に染みつく
トレーダーの皆さん、こんにちは! 多くの個人トレーダーは、動作の遅いウェブスクリプトに頼っています。真の収益性を実現するには、体系化されたフレームワークが必要です。 Astro AIインジケーターは、一般的なチャートオーバーレイではありません。これは、ターミナル上で直接動作する2つのエージェントを含む、コンパイル済みのニューラルネットワークです。 システムの具体的な技術は以下のとおりです。 1. エージェント1:アナリスト(グラフィカルニューラルネットワーク - GNN) 市場は孤立した価格バーではなく、相互に連結されたデータネットワークです。 機能:エージェント1は、グラフィカルニューラルネットワークを使用して、これらの複雑で非線形な関係をマッピングします。 利点:一般的なインジケーターは過去の移動平均しか考慮しませんが、当社のGNNは市場の深い構造的関係をリアルタイムで処理し、個人トレーダーの取引量が大きな影響を与える前に、隠れた相関関係を明らかにします。 2. エージェント2:エグゼキューター(近接戦略最適化 - PPO) パターン認識は、戦いの半分に過ぎません
Quant Direction は、3次元の市場分析ツールです。完全に客観的なアルゴリズムベースの市場分析を提供し、様々なパラメータにわたる正確なパーセンテージ偏差を同時に算出します。高度なAI搭載モデリングツールで開発され、厳密なテストを経て開発されたこのアルゴリズムは、かつてない精度で市場を分析するように設計されています。プラットフォーム上では、あらゆる通貨ペアや金融商品を分析できます。 短期取引、デイトレード、スイングトレードなど、どのような取引スタイルに も、Quant Directionは最適な選択肢です。 オペレーターの本当の利点 Quant Directionの真の利点は、感情、眼精疲労、過剰分析を完全に排除できる点にあります。方向性を探るために何十ものチャートを手作業で精査したり、自分の好みを常に疑ったりする必要がなくなります。このシステムは、8つの時間間隔(5ヶ月から月単位まで)をミリ秒単位で処理します。あらゆる瞬間に市場を支配している主体を正確に明らかにし、常に成功確率が最も高い方向で取引できるようにします。 市場分析の3つの側面 このアルゴリズムは市場を3つの
PainX 400 FAKEOUT DETECTOR MT5 Custom Indicator  ·  Sell-Side Bias  ·  Scalping  ·  RSI(6) Filtered   OVERVIEW   The Spike Fakeout Detector is a non repaint precision technical indicator built exclusively for Crash / PainX synthetic indices on the platform. It is engineered around one of the most consistent and exploitable patterns on this instrument — the false breakout above resistance followed by a sharp price drop. Crash/PainX is a growing index that produces a significant price drop app
Mahra Pro Indicator MT5 Overview Mahra Pro is a MetaTrader 5 chart indicator designed to support structured analysis of XAUUSD (Gold). It combines trend, momentum, volatility and price-structure conditions to identify potential buy and sell setups and display them directly on the chart. The indicator does not open, modify or close trades. All trading decisions and order execution remain under the user's control. Main features • Buy and sell signal arrows on the chart. • Fast and slow EMA lines w
Azimuth Pro
Ottaviano De Cicco
5 (7)
Azimuth Pro V2:MT5向けシンセティック・フラクタル構造分析と確認済みエントリー 概要 Azimuth Pro は Merkava Labs によるマルチレベルスイング構造インジケーターです。4つのネストされたスイングレイヤー、スイングアンカーVWAP、ABCパターン検出、3タイムフレーム構造フィルタリング、そして確定バーでの確認済みエントリー — 1つのチャートで、ミクロスイングからマクロサイクルまでを網羅するワークフロー。 これはブラインドシグナル製品ではありません。ロケーション、コンテキスト、タイミングを重視するトレーダーのための構造ファーストワークフローです。 ️ サマーセール — 夏至とThe Oracle Proの発売を記念して、Azimuth Proが30%オフ。現在279 USD(通常399 USD)。期間限定の夏季オファー。 1. V2での変更点 シンセティック・マルチタイムフレームエンジン 上位タイムフレーム分析をMeridian Proと同じ独自のシンセティックアーキテクチャで一から再構築。よりクリーンなHTFコンテキスト、安定したライブ動作、
The Oracle Pro
Ottaviano De Cicco
5 (1)
The Oracle Pro:MT5向け合成マルチタイムフレーム・バイアスエンジン ️ サマー・ローンチ・オファー — The Oracle Pro を 199 USD で(早期購入者向け)。価格は普及に応じて上昇します。最終価格 399 USD。 The Oracle Pro は、要求の高いプロのトレーダーのために作られた MetaTrader 5 向けのプレミアム・マルチタイムフレーム バイアスエンジン です。ひとつの問いに規律をもって答えます。すなわち、各タイムフレームの現在の方向バイアスは何か、その強さはどれほどか、そしてタイムフレーム同士はどれだけ一致しているか。すべては確定足のみで計算され、リペイントはありません。 The Oracle Pro はマルチファクター・コンセンサス・システムです。独自のインジケーターと最適化されたアルゴリズムを単一の高度なコンセンサス・ベクトルに統合し、それを単一のインジケーター・インスタンス内で現在足と上位足のスタックにわたって読み取ります。複数のチャートにばらばらのツールを積み重ねる代わりに、です。 これは Oracle コンセンサス手法
UZFX {SSS} スキャルピング・スマートシグナル v5.0 MT5は、変動の激しい市場において正確かつリアルタイムのシグナルを求めるスキャルパー、デイトレーダー、スイングトレーダー向けに設計された、リペイントのない高性能な取引インジケーターです。(UZFX-LABS)によって開発されたこのインジケーターは、価格行動分析、トレンド確認、スマートフィルタリングを組み合わせることで、すべての通貨ペアおよび時間枠において、高確率の売買シグナル、警告シグナル、トレンド継続の機会を生成します。 トレードの判断に迷うのはもうやめましょう。明確さ、正確さ、そして規律ある市場執行を求めるトレーダーのために設計された、体系的なシグナルシステムに従い始めましょう。 間違いなく、MQL5で入手可能な最高のインジケーターの一つです。絶対に見逃さないでください!!「スマートなトレーダーのためのスマートシグナル」 最新バージョン5.0がリリースされました。価格は予告なく最大499.99ドルまで値上がりする可能性がありますので、チャンスを逃さないようお早めにお求めください!! 購入を決める前に!無料トライアル
MERAVITH SCANNERは、MetaTrader 5用のプロフェッショナルな金融市場インジケーターで、複数の分析ツールを一つの統合システムにまとめています。独自の出来高加重平均価格(VWAP)手法を使用してすべての計算を自動で行い、主観的な解釈を完全に排除します。 このインジケーターは、すべての資産クラス(FX、株式、指数、商品、暗号通貨)およびM1から月足までのすべての時間軸で動作します。基本原理は「価格は出来高に従う」というものです。MERAVITHは機関投資家の出来高が集中するポイントを特定し、その集中から数学的に正確な価格レベルを導き出します。予測や投機は行わず、計算のみを行います。 MERAVITH SCANNERを使用すると、28の主要FX通貨ペアをすべての時間軸でわずか2~3分でスキャンできます。また、任意の市場をスキャンすることも可能です。例えば、約100銘柄の株式を約10分でスキャンできます。 インジケーターは、消耗レベル、均衡線、偏差、統計レベル、およびターゲット予測を算出します。 チャート要素 Origin Point :すべての計算が始まる起点です。イン
ARICoin is a powerful trading companion designed to generate high-probability entry signals with dynamic TP/SL/DP levels based on volatility. Built-in performance tracking shows win/loss stats, PP1/PP2 hits, and success rates all updated live. Key Features: Buy/Sell signals with adaptive volatility bands Real-time TP/SL/DP levels based on ATR Built-in MA Filter with optional ATR/StdDev volatility Performance stats panel (Success, Profit/Loss, PP1/PP2) Alerts via popup, sound, push, or email Cust
MERAVITH は MetaTrader 5 向けのマルチタイムフレームの出来高・流動性インジケーターで、すべての時間足でトレンド、サポートとレジスタンスのゾーン、エントリー、ターゲット、ストップロスを表示します。市場の完全な流動性マップ、ヘッジファンド流の流動性ツールを提供し、独自の出来高加重平均価格の手法ですべての計算を自動で行うため、主観的な解釈はありません。 FX、ゴールド(XAUUSD)、指数、仮想通貨に対応し、すべての時間足で機能します。 購入後の特典:MERAVITH での取引方法を解説した動画レッスン集。購入後にメッセージをお送りください。 MERAVITH の機能 すべての時間足を分析し、それぞれで有効なトレンドを表示します。 流動性ゾーン(Volume Equilibrium)を示します。強気と弱気の出来高が等しくなる場所です。 すべての時間足の流動性レベルをチャート上に直接表示します。 参考用に市場のテキスト分析を書き出します。 現在のトレンドからエントリー、ターゲット、サポートレベル、ストップロスを計算します。 取引のリスクリワード比を計算します。 口座残高に
Volatility Master for MetaTrader is a real-time dashboard tool that scans up to  50 symbols  to identify high-volatility , trending markets instantly. With bullish/bearish signals, customizable alerts, and a user-friendly interface, it helps you avoid range-bound conditions and focus on high-probability trades. Clarity leads to confidence. Trade confidently and protect your capital effectively with this powerful dashboard. We don't offer free or bonus indicators in exchange of reviews from you.
Cycles Plotter 移動平均と開始日を備えたカスタマイズ可能なサイクルインジケーター Cycles Plotter は、ユーザー入力のみに基づいて、完全にカスタマイズ可能な2つの正弦波サイクルを描画する高度なテクニカルインジケーターです。サイクルを自動生成しません。すべてのサイクルは、ユーザーが設定したパラメーターのみに基づいて計算され、価格の振動と潜在的なトレンド変化を研究するための視覚的ツールをトレーダーに提供し、自動シグナルや予測は生成しません。 重要なポイント: ユーザー定義のサイクル: サイクル 1 P1 と 2 P2 はユーザーが完全に設定できます。サイクルの長さ、振幅、移動平均、正確な開始日と時刻を設定できます。ユーザーがパラメーターを入力しない場合、サイクルは描画されません。 振幅の制御: 各サイクルは異なる振幅を持つことができ、基準となる移動平均に対して振動の高さを調整できます。 トレンド検出: 高速および低速移動平均はサイクルの方向を示します: Fast MA が Slow MA より大きい 上昇フェーズ 緑 lime Fast MA が Slow MA
IQ FX Gann Levels a precision trading indicator based on W.D. Gann’s square root methods . It plots real-time, non-repainting support and resistance levels to help traders confidently spot intraday and scalping opportunities with high accuracy. William Delbert Gann (W.D. Gann) was an exceptional market analyst, whose trading technique was based on a complex blend of mathematics, geometry, astrology, and ancient mathematics which proved to be extremely accurate. We don't offer free or bonus indic
This indicator automatically detects internal & swing market structure, Fibonacci Retracement and Fibo Levels. Features Full internal & swing market structure labeling in real-time Fibonacci Retracement Fibonacci Levels After purchasing the indicator, the full source code is provided, and via indicator buffers it can be easily integrated into your Expert Advisors (EAs) for automated trading strategies.
AriX
Temirlan Kdyrkhan
1 (4)
AriX Indicator for MT5 A powerful trend-following and signal-evaluation tool AriX is a custom MT5 indicator that combines Moving Averages and ATR-based risk/reward logic to generate clear buy/sell signals. It visualizes dynamic SL/TP levels, evaluates past trade outcomes, and displays win/loss statistics in a clean on-chart panel. Key features include: Buy/Sell signals based on MA crossovers ATR-based SL/TP1/TP2/TP3 levels with visual lines and labels Signal outcome tracking with real-time stat
First time on MetaTrader, introducing IQ Star Lines, an original Vedic Astrology Based Intraday Trading Indicator. We don't offer free or bonus indicators in exchange of reviews from you. You won't need any free products with this indicator to make it work. ;) Enjoy! Welcome to the new and updated  IQ Star Lines , the ultimate fusion of ancient planetary cycles and modern quantitative trading, published for the first time on Metatrader. This is an indicator built by the developer, who has spent
Volume Arrow Signal Product Description Volume Arrow Signal is a smart trading indicator designed to help traders identify potential buy and sell opportunities using price action, volume behavior, and directional arrow signals. The indicator places clear arrows directly on the chart, making it easy to spot possible market reversals, trend continuations, and entry opportunities without spending hours analyzing charts manually. Whether you are trading Gold (XAUUSD) , Forex pairs, Indices, or Crypt
GEM Signal Pro GEM Signal Pro は、MetaTrader 5 向けのトレンドフォロー型インジケーターです。より明確なシグナル、より整理されたトレードセットアップ、そして実用的なリスク管理をチャート上で確認したいトレーダーのために設計されています。 単純な矢印だけを表示するのではなく、GEM Signal Pro はトレード全体の考え方を、より見やすく分かりやすい形で表示します。条件が確認されると、インジケーターはエントリー価格、ストップロス、利確目標をチャート上に表示し、トレードセットアップをより効率的に確認できるようにします。 動作の仕組み このインジケーターは、まず内部ロジックに基づいて有効なシードシグナルを検出します。 確認条件が満たされると、GEM Signal Pro はチャート上に完全なセットアップを表示します。これにより、トレーダーはトレード構造をより明確に把握し、手作業による分析を減らすことができます。 チャート上のトレードレベル 確認済みシグナルに対して、GEM Signal Pro は以下を表示できます。 エントリー価格 ストップロス テ
ORB Seeker MT5
Marcela Goncalves De Oliveira
数量限定で特別価格!希少性を維持するための特別価格です! たったの599ドル! ご購入後、ボーナスとしてORB Seeker EAと個人最適化セットファイルをお受け取りいただくため、私にご連絡ください。 クリーンなセッションブレイクアウトを自信を持ってキャッチしましょう! ORB Seeker MT5は、正確性、シンプルさ、柔軟性、そして明確なチャート構造を求めるトレーダー向けに開発された、プロ仕様のオープニングレンジブレイクアウト(ORB)インジケーターです。 このシステムは、あらゆる銘柄のプレマーケットまたはカスタムセッションのレンジを自動的にプロットし、エントリー、ストップロス、テイクプロフィット、およびオプションの50%部分TPレベルを含む明確なブレイクアウトシグナルを提供します。すべての計算結果はリアルタイムでチャート上に表示されます。 ロンドンオープン、ニューヨークセッション、アジアセッション、または独自のカスタム市場時間帯で取引できます。ORB Seeker MT5は選択したセッション時間帯に合わせて調整されるため、市場レンジ、ブレイクアウトレベル、トレードレベルの位
KenKem Master Volume Profiler - Brief Introduction A Display-only volume-profile cockpit for XAUUSD, BTCUSD and other liquid symbols. Draws profile structure, multi-timeframe flow, EMA trend and study-only setup markers. Places no orders. Not a signal service.  It maps where the market has actually traded and reads recent order flow, so you can see structure and lean at a glance.  What it shows: Master and local volume profiles (POC and value-area high/low) - the price shelves that matter. A liv
Presenting one-of-a-kind Gann Indicator for XAUUSD IQ Gold Gann Levels is a non-repainting, precision tool designed exclusively for XAUUSD intraday trading. It uses W.D. Gann’s square root method to plot real-time support and resistance levels, helping traders spot high-probability entries with confidence and clarity. William Delbert Gann (W.D. Gann) was an exceptional market analyst whose trading technique was based on a complex blend of mathematics, geometry, astrology, and ancient calculation
AriFocus - Non-Repainting Buy/Sell Signals AriFocus - one clear signal. AriFocus marks buy and sell signals directly on the chart and suggests a stop-loss level for each one. Every signal is confirmed on bar close and never repaints. - Buy/sell arrows, confirmed on bar close - Suggested stop-loss level for every signal - Trend band and candle coloring to show direction at a glance - 10 ready-made presets, or your own settings (14 calculation methods) - Pop-up, push and email alerts with entr
Navigator Equilibrium:市場のフェーズ、モメンタム、ピーク、ダイバージェンスをひとつのウィンドウで モメンタム・オシレーター、トレンドフィルター、ボラティリティ指標、ダイバージェンス・スキャナーを行き来する必要はもうありません。Navigator Equilibrium は、それらを色分けされたひとつのウィンドウにまとめました。モメンタムが強まっているのか弱まっているのか、どちらが主導権を握っているのか、相場がトレンド中なのか持ち合いなのか、そして価格とモメンタムがどこで食い違っているのかが、ひと目でわかります。 相場を明確に読み取りたい裁量トレーダーにも、整理されたドキュメント付きのバッファを必要とする EA 開発者にも向いています。 他との違い 上昇・下落だけではない、5つの状態を持つヒストグラム。 方向に加えて、モメンタムが強まっているのか、弱まっているのか、ピーク状態まで伸びきっているのかを色で示します。 相場環境を示すゼロライン。 色が変わり、相場がトレンド中か持ち合い中かを教えてくれます。 「誰が主導権を握っているか」がひと目でわかる。 ヒストグラムの棒
一言でいうと このインジケーターは RSI と MACD という2人の専門家を1つにまとめたもの です。2つのチャートを別々に見て判断する代わりに、両方が同意したときだけ「買い」または「売り」の矢印を表示します。 矢印は再描画されません 。一度出現すれば、そのまま固定されます。 「コンボ」の意味 通常、トレーダーは RSI(値動きの勢い)と MACD(トレンドの方向)を別々に見ます。しかし両者が矛盾することも多いです。 このインジケーターでは、 両方が同時に同意したときのみシグナル を出します。これにより、多くの偽シグナルが排除されます。 画面で見えるもの 価格チャートとは別のインジケーターウィンドウ 青と赤の矢印 —— そのまま使えるシグナル 拡大表示された MACD ヒストグラム(見やすく強調されている) RSI と MACD のラインも表示されるが、注目すべきは矢印 こんな人におすすめ 初心者 —— 2つのインジケーターを別々に解釈し、矛盾に対処する必要がない 経験者 —— シグナルの高速フィルタリングと、再描画しないクリアなロジック 迷いたくない人 —— 「買い」「売り」「待て
VTrende Pro
Andrii Diachenko
5 (1)
VTrende Pro - MTF indicator for trend trading with a display panel for MT5 *** Videos can be translated into any language using subtitles (video language - Russian) Although the signals of the VTrende Pro indicator can be used as signals of a full-fledged trading system, it is recommended to use them in conjunction with the Bill Williams TS. VTrende Pro is an extended version of the VTrende indicator. Difference between Pro version and VTrende: - Time zones - Signal V - signal 1-2 waves -    S
Ace Trend
Mikhail Sergeev
5 (3)
私たちはあなたにトレンド取引の世界でゲームのルールを変える革命的な指標を提示します。 指標は、パフォーマンスを再考し、前例のない高さにあなたの取引経験を高めるように設計されています。 私たちの指標は、競合他社とは一線を画す高度な機能のユニークな組み合わせを誇っています。 "実質の価格設定要因"の先端技術は最も困難で、揮発市況の最高の安定性を保障する。 不安定なパターン、壊れた指標に別れを告げ、意識的で制御された取引を歓迎します。 指標は単なる美しい絵ではありません! 指標は、トレーダーの側にオッズをシフトし、それによって利益を得る必要があります。 インジケータ信号(完全自動モード)に基づいて取引結果に慣れる: https://www.mql5.com/ja/signals/2339244 AceTrendは、rbtiバージョンによるトレンド指標のランキングで第一位にランクされています。AceTrend-取引における最大の収益性と制御。 私たちの指標は、歴史ではなく、現在の市場相場に基づいて収益性を強調しています。 革命に参加-あなたの取引経験の可能性のロックを解除! インジケーターは、
このインジケーターは、市場で 関心が示されたゾーン をハイライトし、その後に 注文の蓄積ゾーン を表示します。 これは、大規模な**板情報(オーダーブック)**のように機能します。 これは、 巨大な資金 のためのインジケーターです。その性能は卓越しています。 市場にどんな関心が存在していても、 必ず目に見えるようになります 。 (これは 完全に再設計され、自動化されたバージョン です。もはや手動分析は必要ありません。) トランザクションスピード(取引速度) は新しい概念のインジケーターで、市場で大口注文が どこに・いつ 集中しているかを示し、それに基づいたチャンスを提供します。 トレンドの変化を 非常に早い段階 で察知することができます。 FXでは「出来高」と呼ばれているものは誤解されています。実際には、これは 時間あたりの価格変動量 です。したがって、正しい名称は トランザクションスピード です。 考え方・行動・分析の仕方すべてが問われます。 分析パラダイムの転換は非常に重要です。 このインジケーターは、FXにおける出来高の考え方を 根本から再定義 し、論理的な形で正確に活用する、
The Louis SMC & Liquidity Master is a complete, institutional-grade market structure and liquidity mapping system built for MetaTrader 5. Designed for serious Smart Money Concepts (SMC) traders, this tool dynamically tracks multi-timeframe trends, supply and demand zones, and critical liquidity sweeps without cluttering your chart. Whether you trade major Forex currency pairs or highly volatile synthetic indices like Boom and Crash, the indicator automatically adapts to price action, filtering
作者のその他のプロダクト
JT360 Volume – Free Volume Indicator for MT5 Simple. Clear. Configurable. JT360 Volume is a lightweight volume indicator for MetaTrader 5, designed to help traders monitor market activity and compare current volume with its moving average. The indicator displays a color-coded volume histogram together with a configurable volume moving average in a separate chart window. Key Features Color-Coded Volume Histogram Royal Blue: Volume increased compared with the previous candle. Dim Gray: Volume decr
FREE
JT360 VWAP V1.21 – Daily, Weekly & Monthly VWAP for MetaTrader 5 Precise VWAP Analysis Directly on Your Chart JT360 VWAP is a professional chart indicator for MetaTrader 5 that displays Daily, Weekly, and Monthly Volume Weighted Average Price (VWAP) levels. It also includes three pairs of daily standard deviation bands to help traders assess price position and deviation from the daily VWAP. Key Features Daily VWAP: Displays the volume-weighted average price for the current trading day. Weekly VW
FREE
JT360 OrderPanel Pro – Professional Trade Execution and Risk Management for MetaTrader 5 Product Overview JT360 OrderPanel Pro is an interactive trading panel for MetaTrader 5 that combines trade execution, risk calculation, position management, and multiple protection mechanisms within a single interface. The panel is designed for traders who make their own trading decisions and want to apply structured risk rules, controlled order execution, and additional safety mechanisms. In addition to sta
JT360 DNA Cascade Trade Copier 統合リスク管理を備えた拡張可能なMaster–Slaveアーキテクチャ ひとつのHub。複数の階層。拡張可能なトレーディング・インフラ。 JT360 DNA Cascade Trade Copier は、 JT360 Master Hub、JT360 Slave Auto ID、JT360 Bridge をMetaTrader 5向けの統合ソリューションとして組み合わせた製品です。 本システムは、複数の口座やターミナルで構成されるトレーディング環境を構築するための、柔軟なカスケード・アーキテクチャを採用しています。ローカル環境とVPSを活用して構成を拡張でき、取引のコピー、設定可能なリスクパラメータ、ポジション管理をひとつの統合システムで運用できます。 単なる取引コピーを超えて、トレーディング・インフラを体系的に構築、拡張、管理するためのソリューションです。 主な機能 1. SCALABLE CASCADE ARCHITECTURE 複数階層に対応する柔軟な取引配信 統合されたMaster–Slave–Bridgeアーキテク
フィルタ:
レビューなし
レビューに返信