Erianux Gaps
- Indicators
-
ERIANUX, LLC
 Dedicated Full-Stack Developer blending a strong foundational education with practical expertise in modern software engineering. Proficient across the entire development lifecycle—from crafting intuitive, user-centric interfaces with React and Vue to architecting robust backend systems using Python
 - Version: 1.0
- Activations: 10
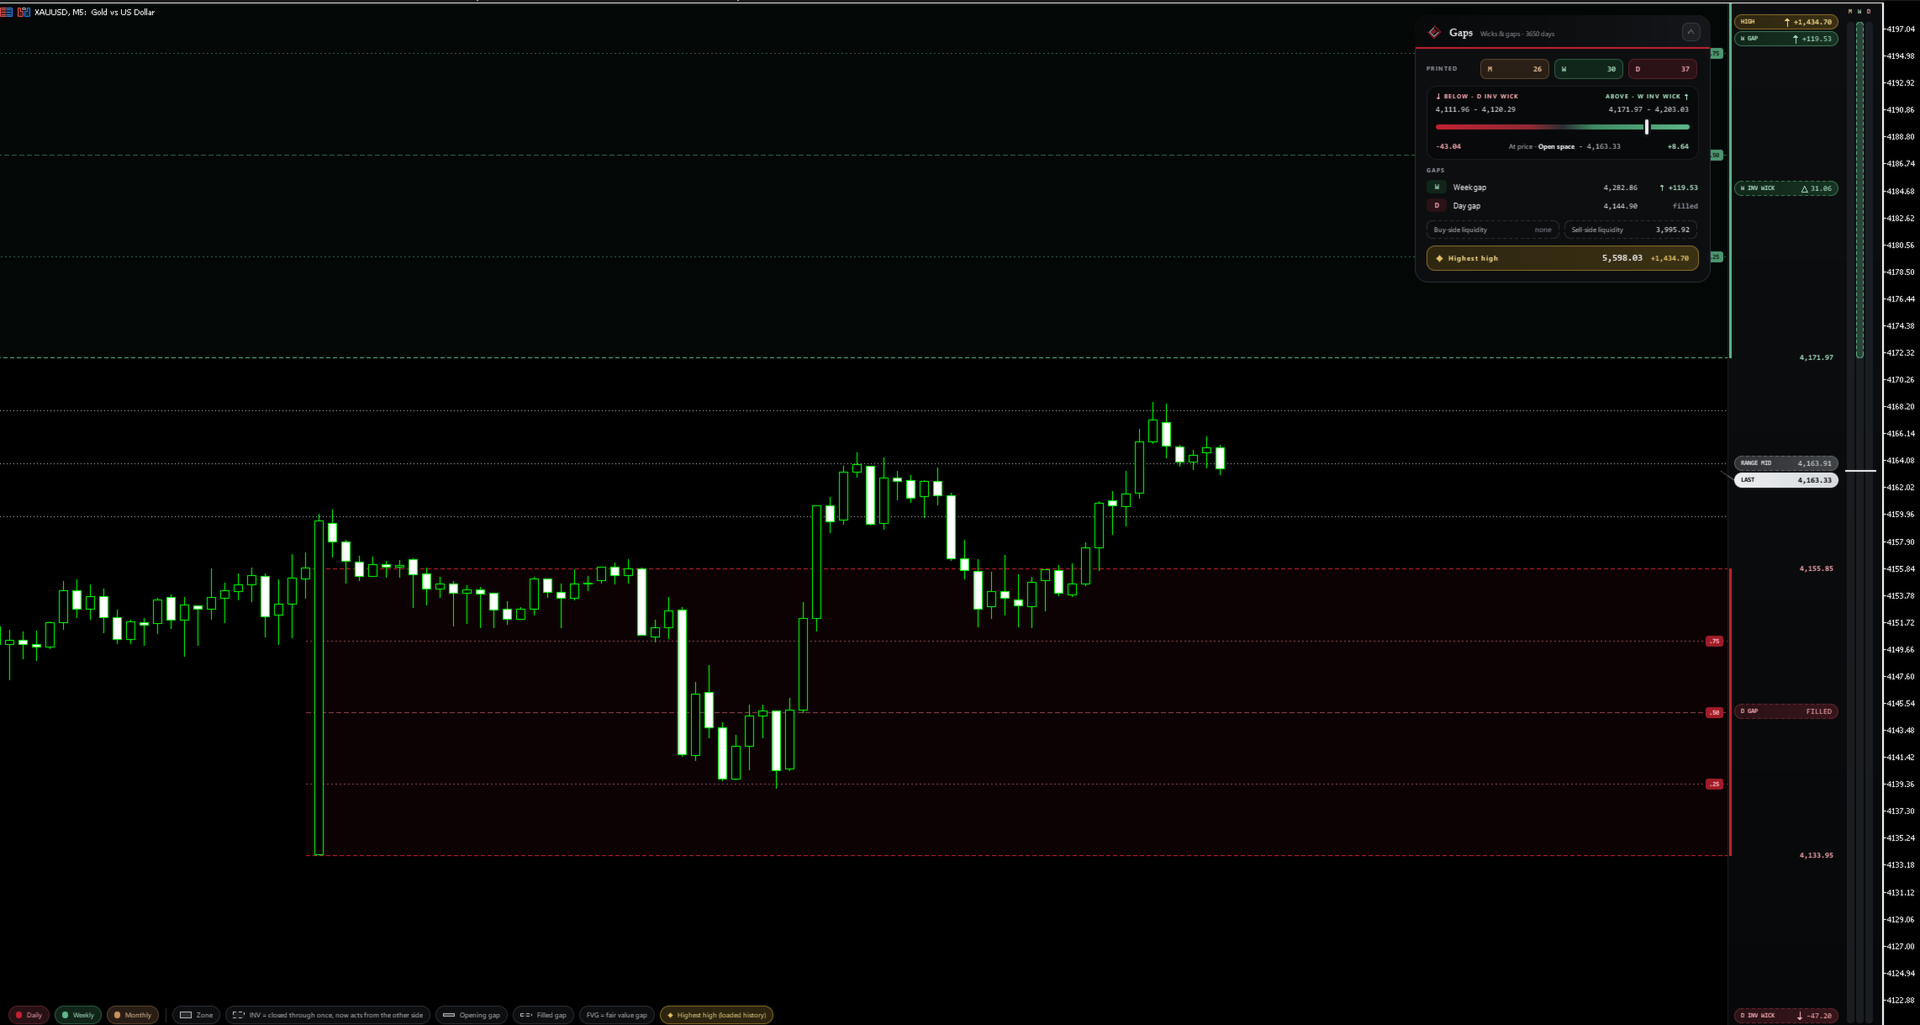
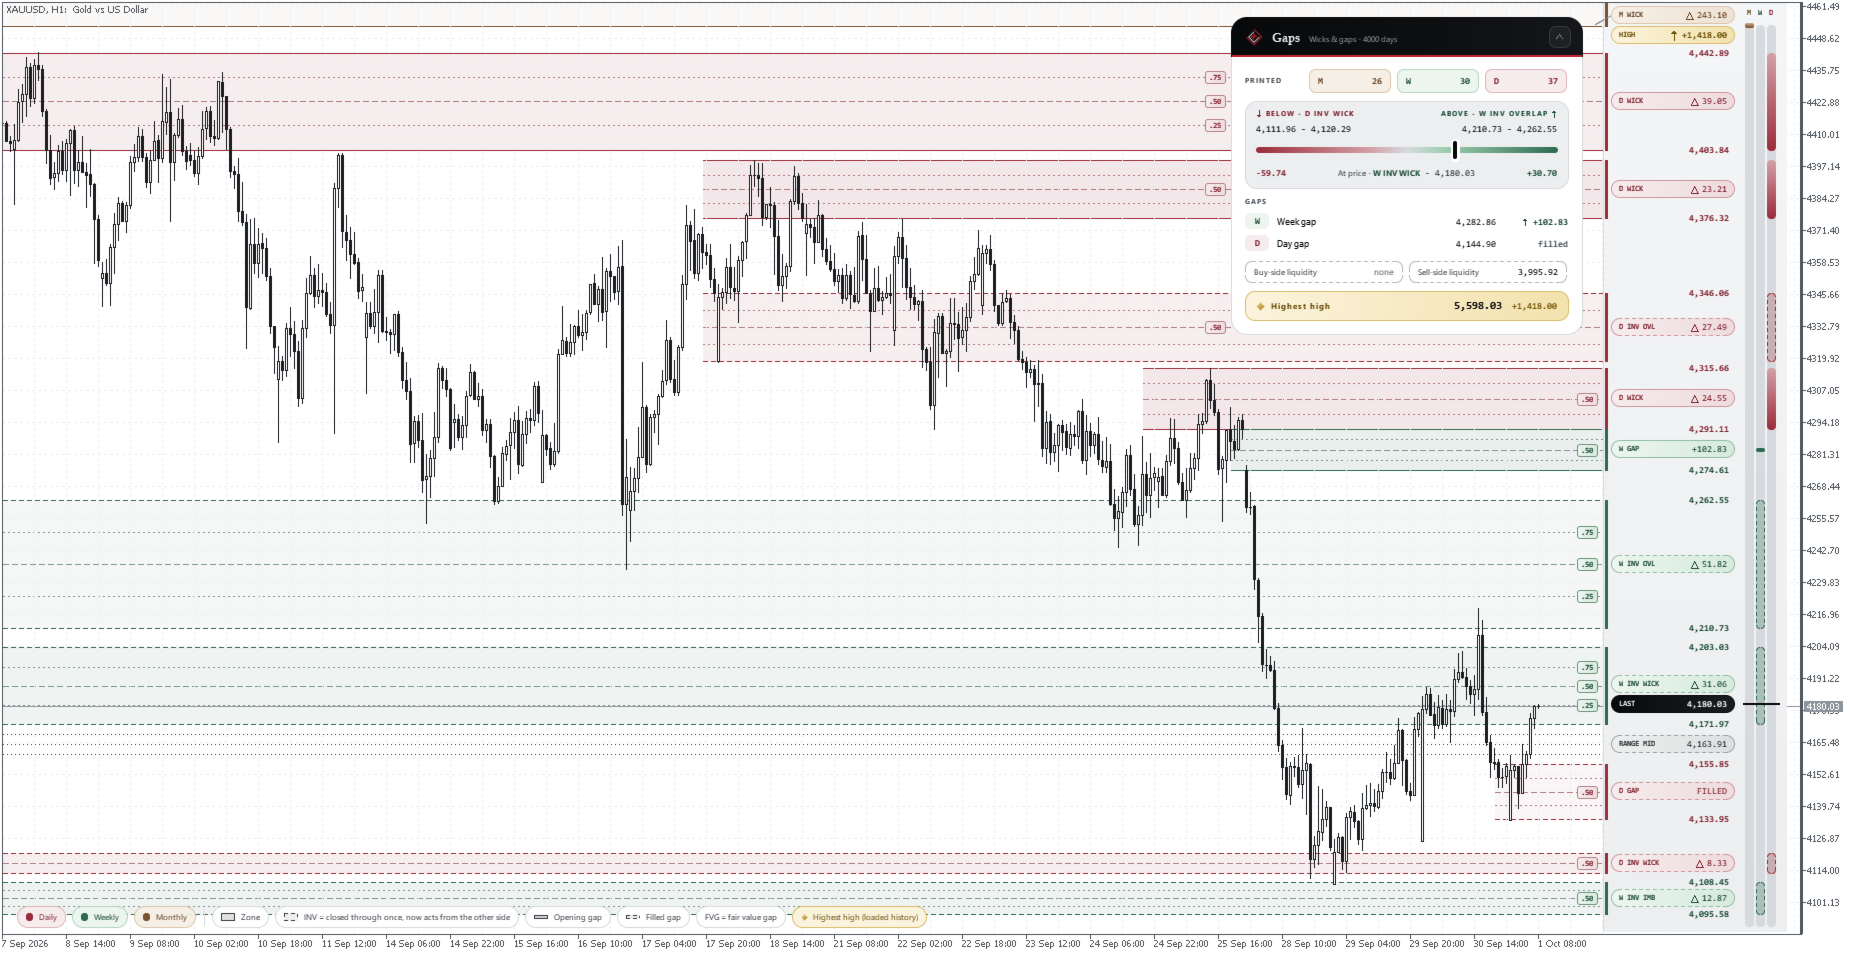
Gaps draws the levels that higher timeframes leave behind, on any chart you trade from. Every level is read off the broker's daily candles, so a 1-minute chart and a 4-hour chart show the same map in the same places. One file, no DLL.
Four level families, on monthly, weekly and daily candles
- Fair value gap: three candles with an impulse in the middle and the outer two not touching. Price left without trading there.
- Wick zone: a swing candle's rejected wick, from the body edge to the extreme.
- Imbalance: the gap between two consecutive candle bodies.
- Overlap: the shared body range of two candles pushing the same way.
- A level is born only from a closed month, week or day. Levels never move back in time: a level appears only after its candle has closed, and it changes only when a later candle closes through it. A level that price closes through flips (it then acts from the other side); closed through again, it is removed.
- The hierarchy keeps the chart readable: opening gaps first, then monthly, weekly and daily. A level that shares price with one already placed is not printed, so two zones do not stack on one price.
- Zones smaller than 2 pips or 5 % of that timeframe's average range are left out (adjustable, or set your own smallest zone in pips).
Opening gaps, liquidity and the highest high
- The week opening gap and the day opening gap, with their price and distance. Once price trades back to the previous close, a gap is marked FILLED (dashed) and stays on the map. Defaults follow the market (forex: the weekend gap only; indices and metals: both), and you can switch each one on or off.
- Equal highs and equal lows over the last 250 days, pooled, with the nearest untouched pool above and below.
- The highest high of the loaded history, as a line and a card. It is the high of the days the terminal holds, not an exchange record.
- The projected range: the open space between the nearest shown level below and above the last daily close, with its quarter lines. It is the same on every chart timeframe.
Reads off the live price
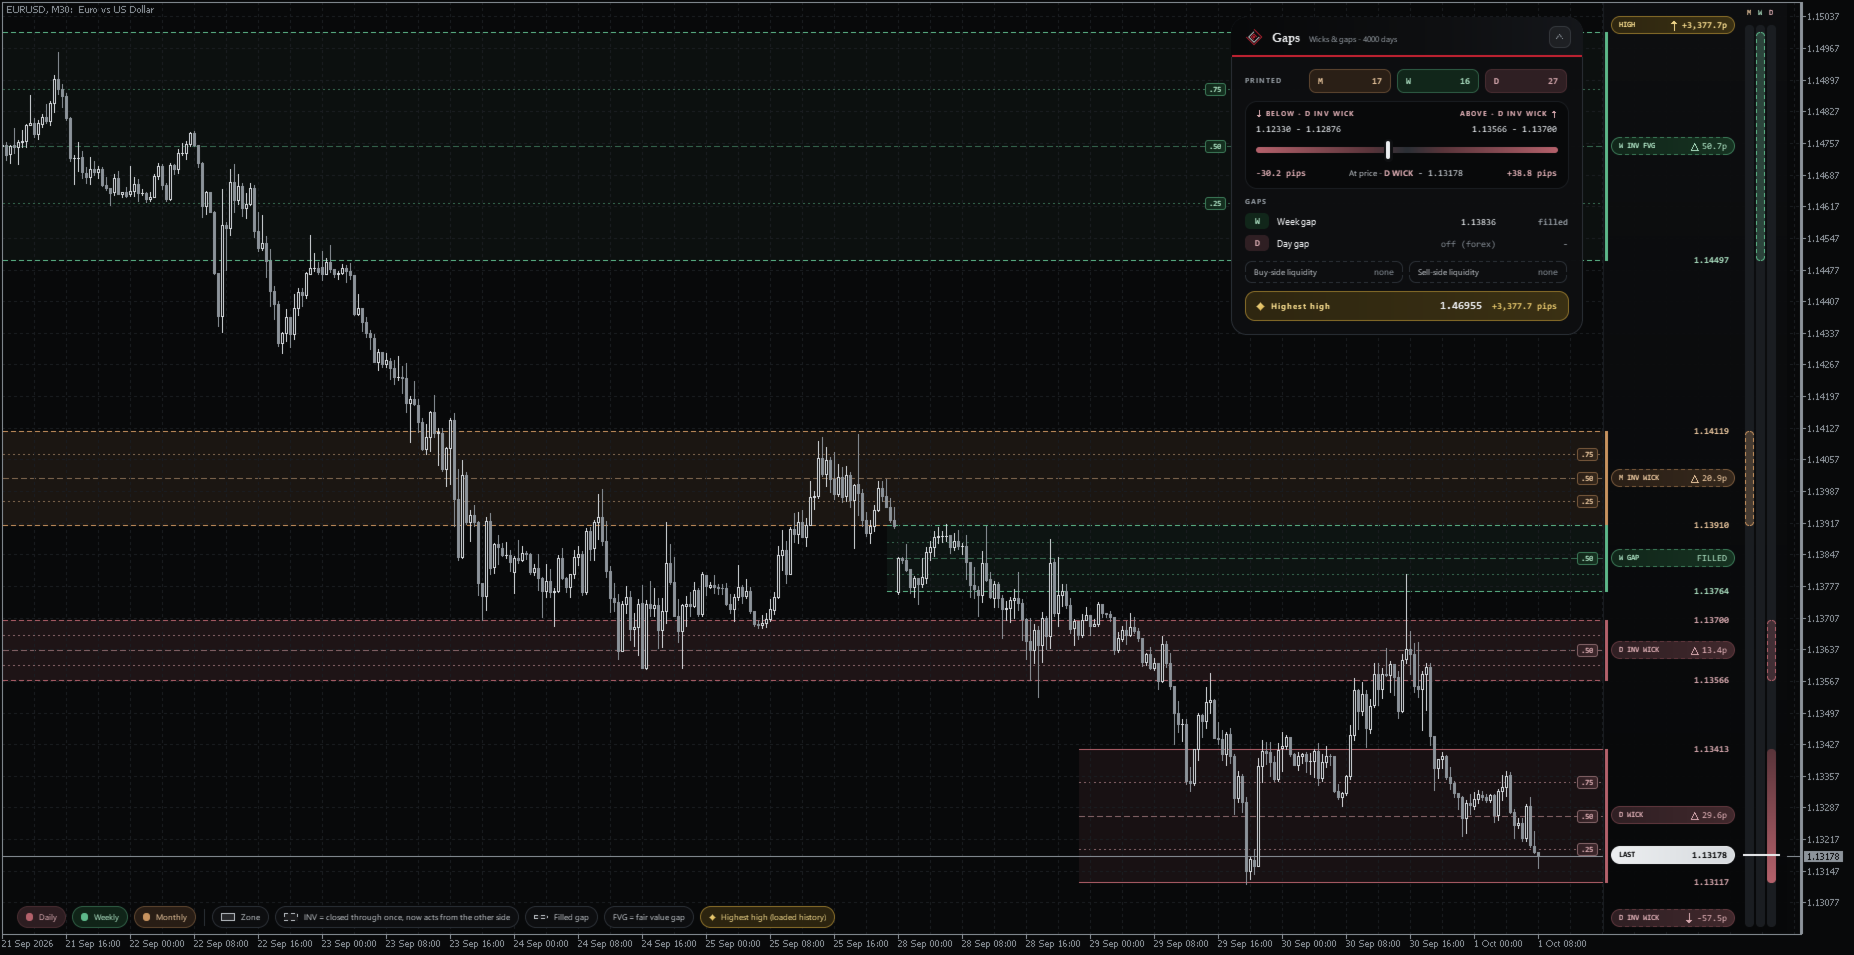
- The panel shows what is printed (M / W / D), the nearest level below and above with a meter and signed distances, the opening gaps, the liquidity pools and the highest high.
- The price rail in the chart's right margin carries the nearest levels, the open gaps and LAST, with the M / W / D lanes showing every level's position. A nearest level that is out of view is pinned to the rail's edge with its distance.
- Every distance and LAST follow the live price; on forex, distances and sizes read in pips. The levels themselves come from closed candles only.
The broker's day
- The broker's clock sets the day. Brokers on GMT+0 print a small Sunday candle; Gaps merges Sunday and Saturday candles into Monday for markets that close on the weekend, and keeps every day for markets that trade seven days (crypto). You can override this.
- Friday's daily levels, the finished week and (at a month end) the finished month appear at the weekend, not on Monday.
Look
- Light and dark, chosen from your chart background or set by hand. Every line, label and text keeps at least 3:1 contrast on white, black and grey charts.
- Each label sits on its own zone, in a free spot near the newest candles. Labels and gap distances can be hidden; the panel, rail and legend each have their own switch, and a caption stands in when the panel is off. A colour-blind palette is included.
Diagnostics
- A diagnostics panel shows the market type, the daily history loaded, the smallest zone in use, the self check and the last frame time.
- Problems are written to MQL5\Files\Erianux\Gaps\diagnostics.txt with what happened and where.
Good to know
- Gaps needs the symbol's daily history. The terminal's Max bars setting and the broker's history depth set how far back the map goes (up to 4,000 days).
- The map is built from the last 4,000 days; as days roll on, the oldest day drops out of that window.
- The Strategy Tester shows the map in visual mode; in the plain tester it builds silently and prints a summary line.