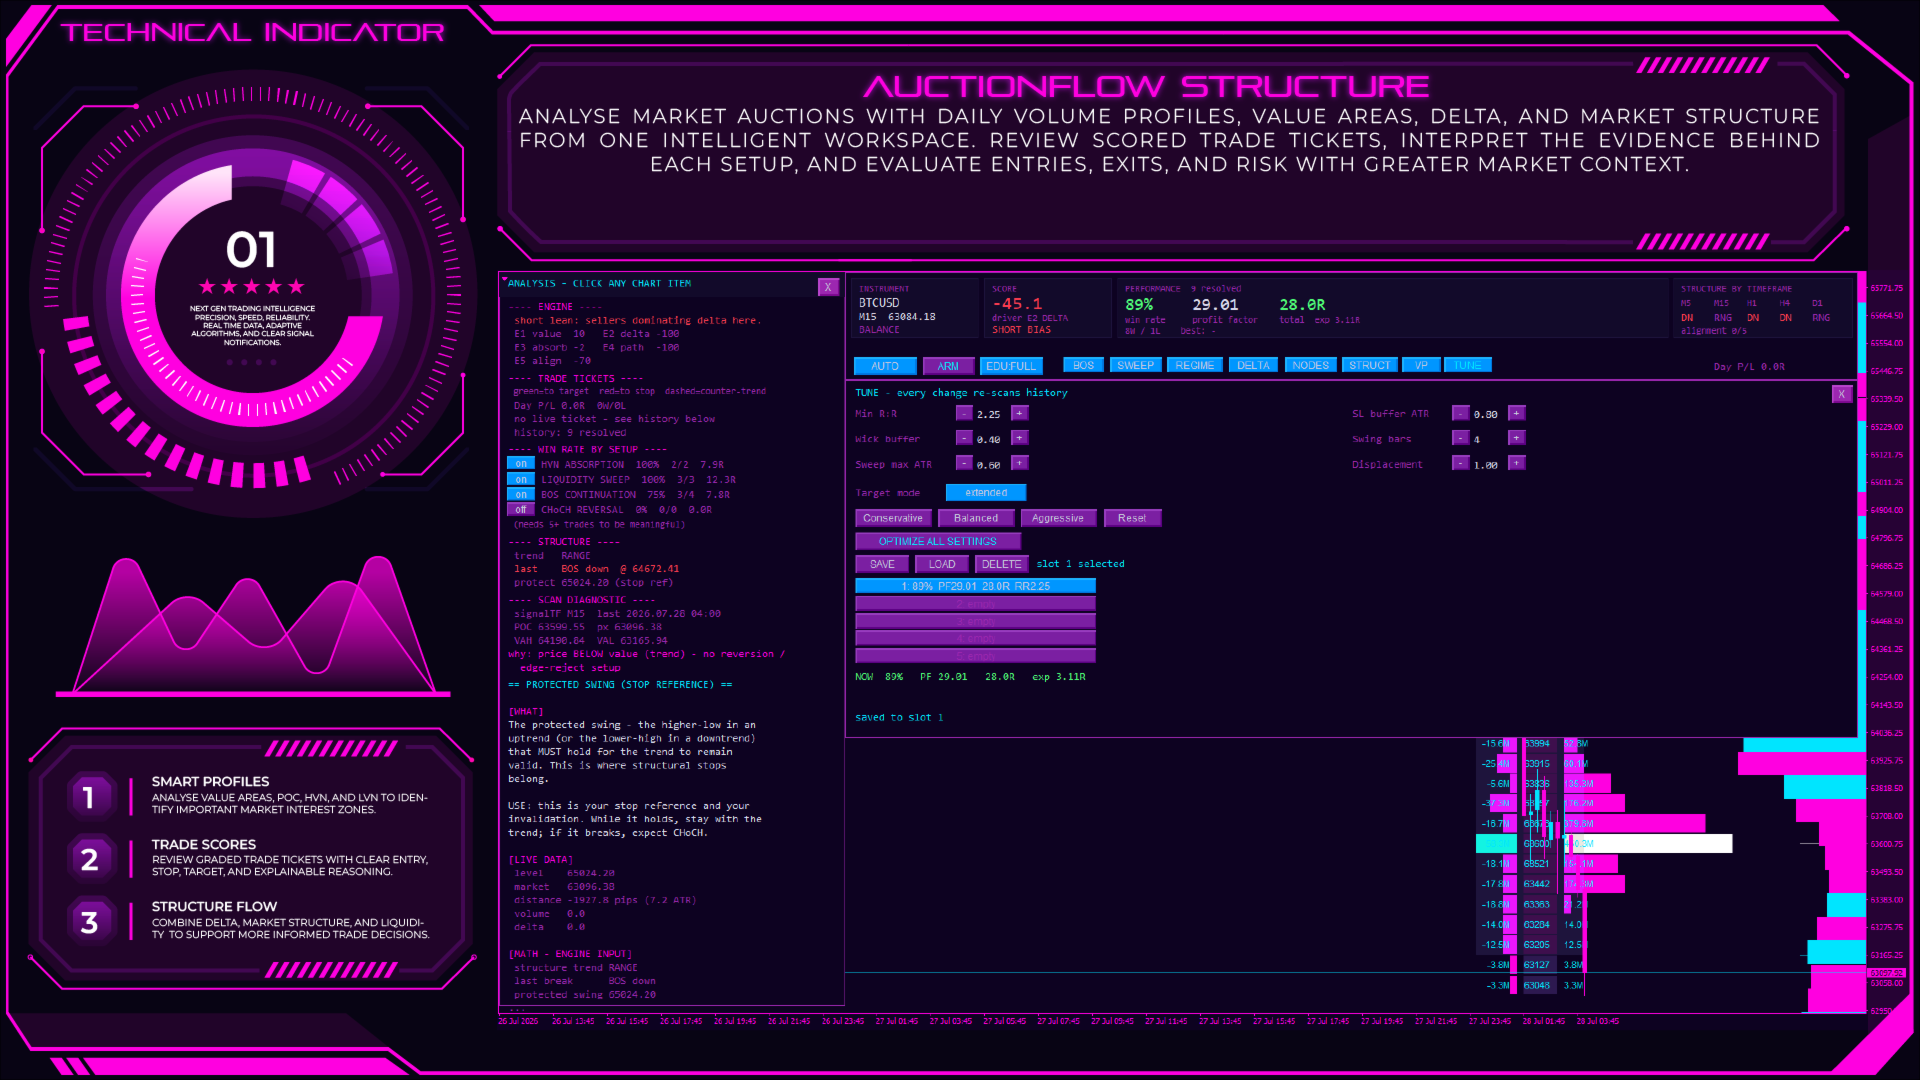
AuctionFlow Structure

AuctionFlow Structure is a Volume Profile and Market Structure Indicator that combines Volume Profile, Delta Analysis, Market Structure, and a transparent decision engine to help traders evaluate potential trading opportunities using objective market evidence. Instead of relying on a single signal, the indicator analyzes Point of Control (POC), Value Area High (VAH), Value Area Low (VAL), High Volume Nodes (HVN), Low Volume Nodes (LVN), buy and sell delta, Break of Structure (BOS), Change of Character (CHoCH), and liquidity sweeps before generating an easy-to-understand trade ticket with its supporting analysis. Designed for Forex traders, Index traders, Gold (XAUUSD) traders, Cryptocurrency traders, stock traders, scalpers, day traders, swing traders, and traders using Volume Profile, Order Flow, Auction Market Theory, Smart Money Concepts (SMC), and market structure analysis, AuctionFlow Structure transforms complex auction data into an organized trading workspace. Every generated setup includes a transparent explanation showing why the market was evaluated in a particular way, helping traders understand the reasoning behind each analysis rather than relying on a black-box signal.


Core Functionality

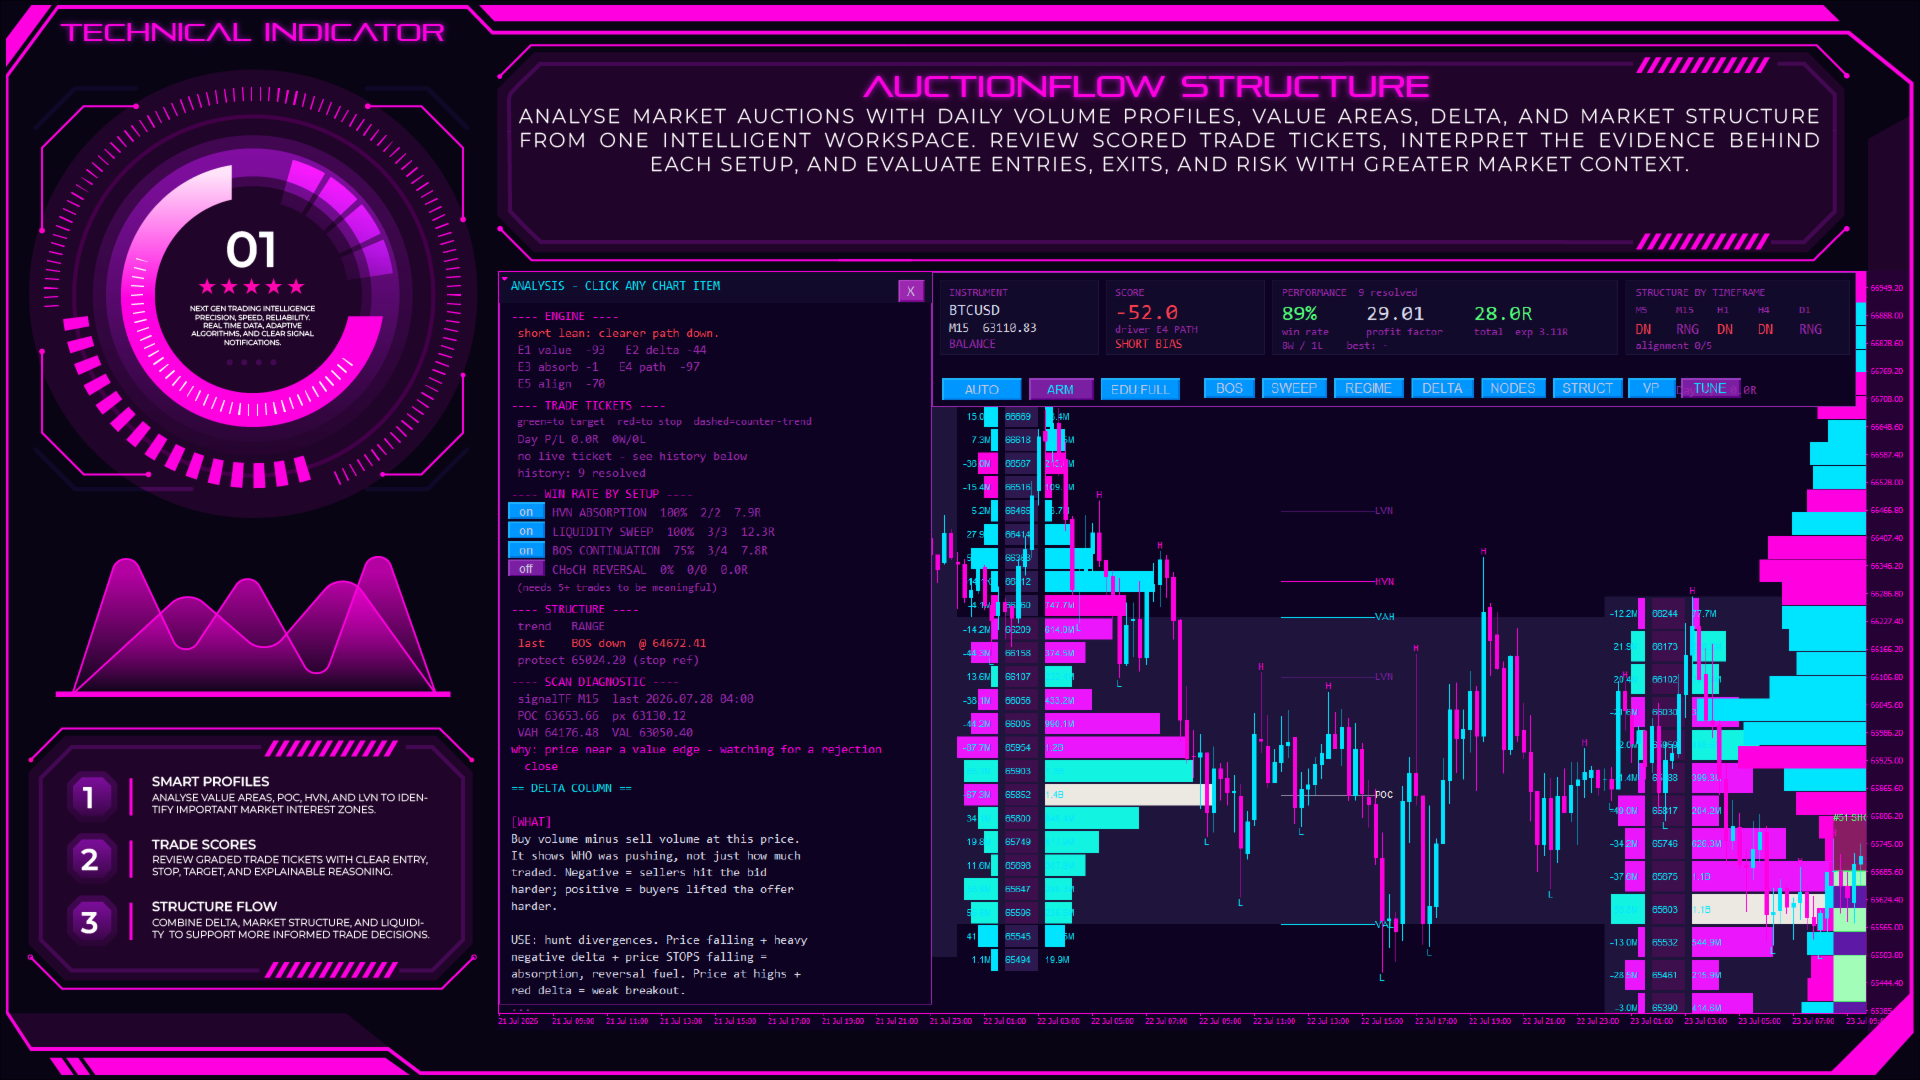
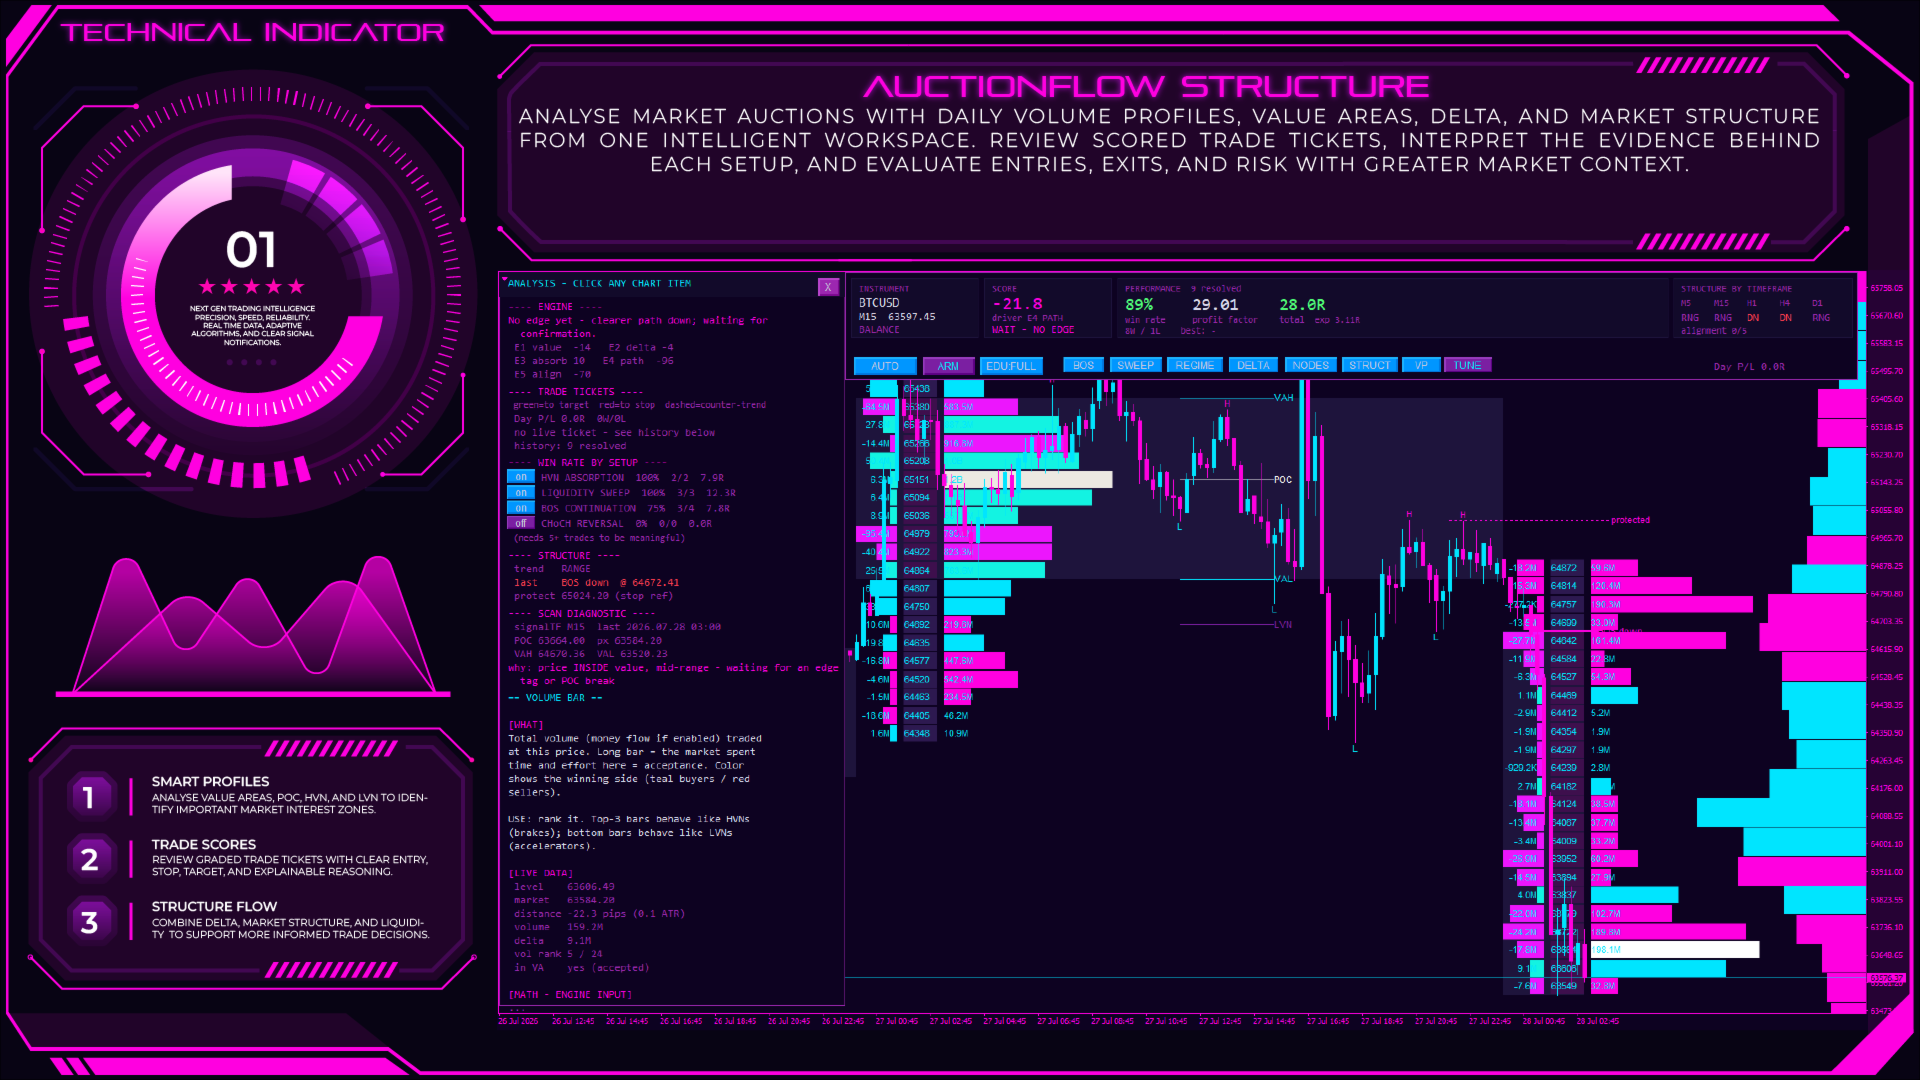
AuctionFlow Structure builds an individual Volume Profile for each trading session by analysing the distribution of traded volume across price levels. From every profile, the indicator automatically calculates the Point of Control (POC), Value Area High (VAH), Value Area Low (VAL), and identifies High Volume Nodes (HVN) and Low Volume Nodes (LVN). Together, these levels provide an objective view of where the market has accepted value, rejected price, and concentrated trading activity, helping traders study important areas of support, resistance, and price acceptance.

To provide additional market context, each profile also displays a Delta column showing the difference between buying and selling activity at each price level. This allows traders to compare price movement with underlying buying and selling pressure and observe situations where market participation may differ from price direction.

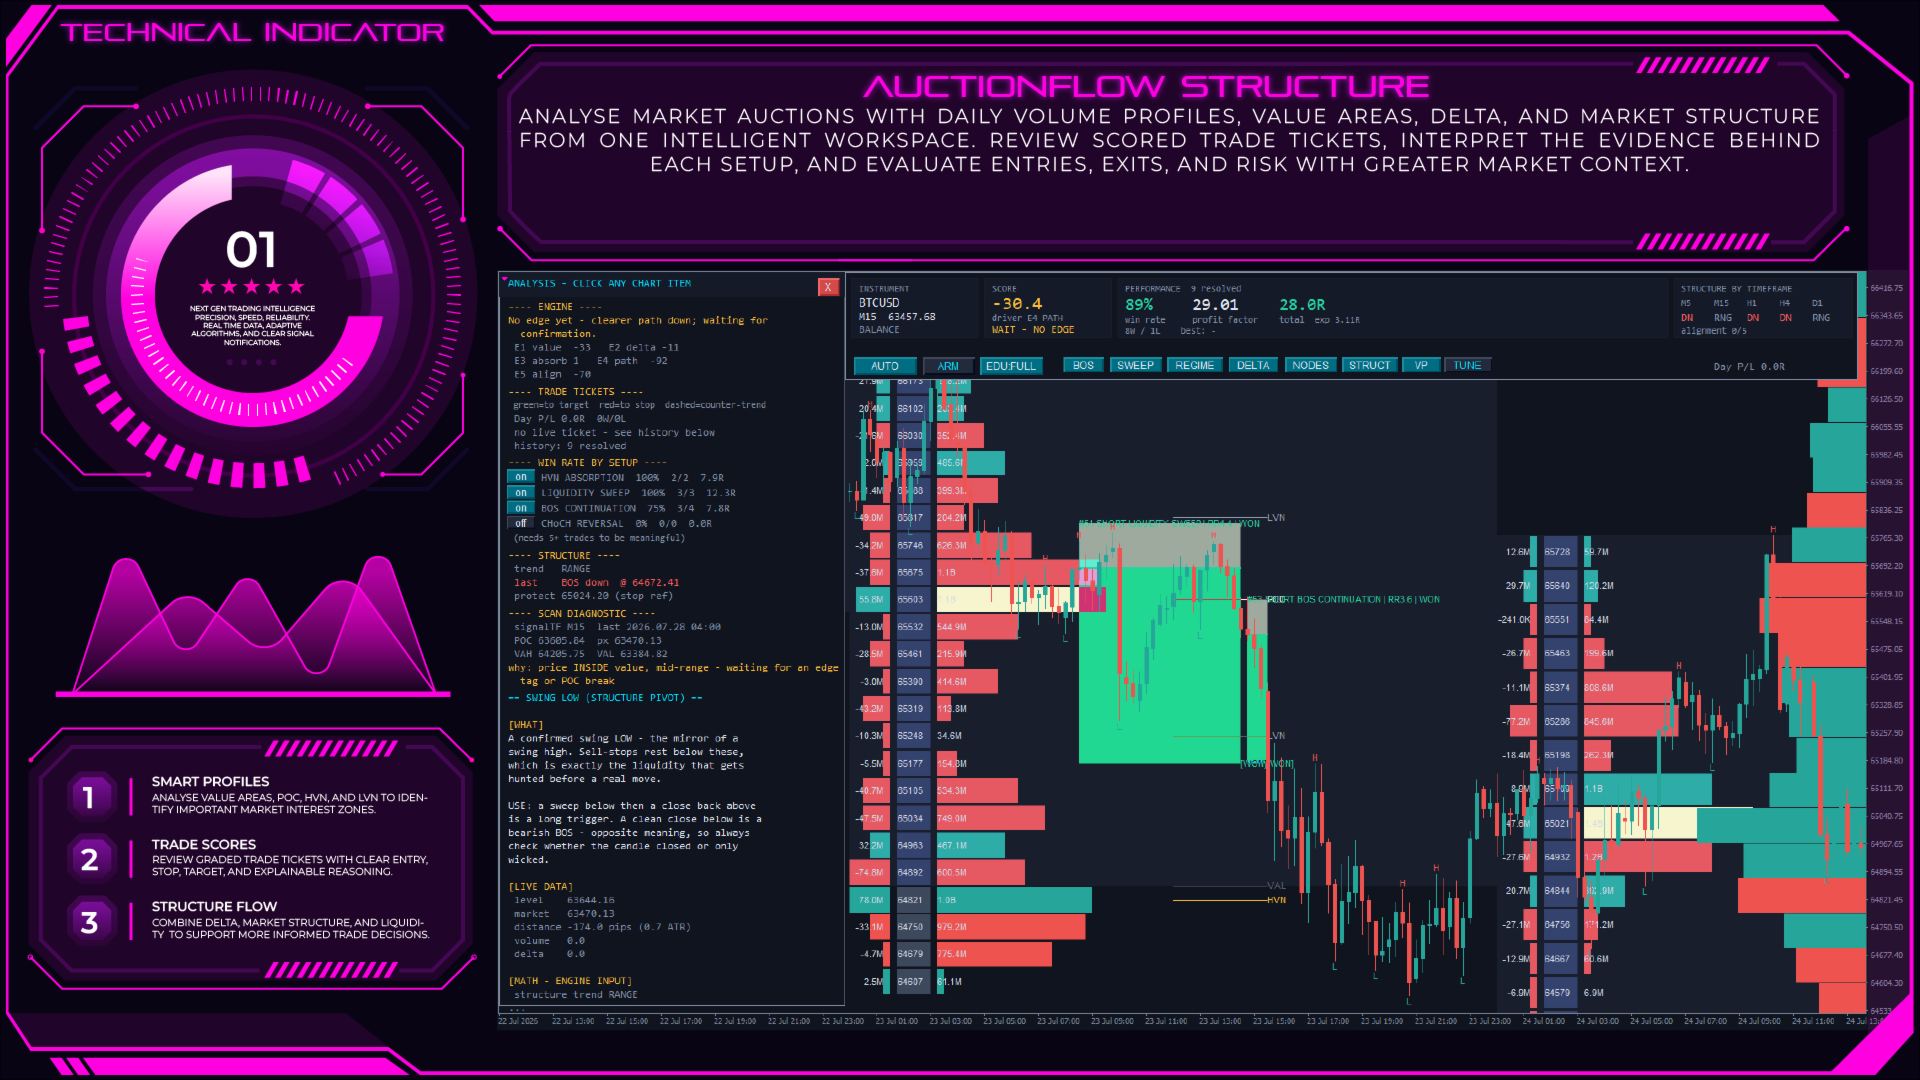
Rather than evaluating volume information alone, the indicator combines profile analysis with market structure. Every qualifying candle is examined for Break of Structure (BOS), Change of Character (CHoCH), liquidity sweeps, trend alignment, value location, delta behaviour, absorption, and price path. These independent factors are processed by a built-in decision engine, which grades potential trading opportunities and generates a structured trade ticket only when predefined evidence requirements are satisfied.

Each trade ticket includes suggested entry, stop reference, target, expected risk-to-reward ratio, and a plain-language explanation describing why the setup received its evaluation. Instead of displaying only a buy or sell signal, the indicator explains which market conditions contributed to the decision, making every analysis transparent and easier to review.

An integrated analysis dashboard displays the current instrument, overall market score, directional bias, market structure across multiple timeframes, historical setup statistics, and the active decision engine components. Interactive controls allow traders to rescan historical data, adjust engine parameters, change dashboard appearance, and immediately update the analysis without removing or reloading the indicator.

Selecting chart objects opens an interactive analysis dossier, providing a detailed breakdown of each detected setup, profile level, market structure event, or generated trade ticket. This object-based approach transforms every important chart element into an interactive source of market information, allowing traders to review historical decisions and understand how different pieces of evidence contributed to the overall analysis.

AuctionFlow Structure also supports configurable popup alerts, sound alerts, mobile push notifications, and email alerts for new trade tickets, important profile levels, and significant market structure events. Signal timeframe, history depth, decision thresholds, risk-to-reward requirements, and dashboard scaling can all be customized to suit different markets and trading styles while maintaining a consistent analytical workflow.


Key Features

  • Daily Volume Profiles – Automatically builds a Volume Profile for each trading session, displaying POC, VAH, VAL, HVN, and LVN to visualize value distribution and key market levels.
  • Delta Analysis – Displays buy and sell delta at each price level, helping traders compare price movement with underlying buying and selling pressure.
  • Composite Volume Profile – Creates a visible-range composite profile that highlights longer-term value areas and important volume concentrations.
  • Evidence-Based Decision Engine – Evaluates market conditions using value location, delta, market structure, absorption, path analysis, and trend alignment before grading potential trading opportunities.
  • Transparent Trade Tickets – Generates structured trade tickets with entry, stop reference, target, risk-to-reward ratio, and a plain-language explanation showing why the setup received its evaluation.
  • Market Structure Detection – Automatically identifies Break of Structure (BOS), Change of Character (CHoCH), and Liquidity Sweeps to provide additional confirmation during market analysis.
  • Interactive Analysis Dossier – Click any profile, structure event, or trade ticket to view a detailed explanation of the underlying analysis directly on the chart.
  • Live Dashboard – Monitor market score, directional bias, performance statistics, multi-timeframe structure, and decision engine status from an adjustable on-chart dashboard.
  • Flexible Alerts – Supports popup, sound, mobile push, and email notifications for new trade tickets, profile levels, and market structure events.
  • Extensive Customization – Configure signal timeframe, history depth, dashboard scaling, risk-to-reward thresholds, dashboard themes, and engine parameters to match different trading workflows.

Practical Trading Application

AuctionFlow Structure is designed for traders who combine Volume Profile, Order Flow, Auction Market Theory, and market structure analysis when studying financial markets.

Many traders use Volume Profile to identify where the market has accepted or rejected price. By combining POC, Value Area, HVN, LVN, and Delta Analysis, the indicator provides objective reference points for evaluating support, resistance, and price acceptance.

For market structure traders, automatic detection of BOS, CHoCH, and Liquidity Sweeps helps identify structural changes that may confirm or challenge the current market direction. These events can be reviewed together with value distribution rather than in isolation.

For traders using Smart Money Concepts (SMC) or institutional-style analysis, AuctionFlow Structure provides additional context by combining market structure with liquidity behaviour, delta, and auction-based price analysis. The transparent decision engine explains how different factors contribute to each evaluated setup, allowing traders to understand the reasoning instead of relying on hidden calculations.

For scalping and day trading, configurable signal timeframes and live dashboard updates help monitor changing market conditions throughout the trading session. Historical trade tickets and profile replay also provide useful context when reviewing previous market behaviour.

For swing trading, the composite volume profile and higher timeframe market structure help identify broader value areas and longer-term price acceptance zones. Traders can compare current market activity with historical volume distribution when analysing developing trends.

Whether trading Forex, Gold (XAUUSD), Indices, Cryptocurrencies, Stocks, or other markets, AuctionFlow Structure provides an organised framework for combining Volume Profile, Delta Analysis, and Market Structure into a single technical analysis workflow.


Ideal For

AuctionFlow Structure is designed for traders who combine Volume Profile, Market Structure, Order Flow, and Price Action when analysing financial markets.

This indicator is suitable for:

  • Forex Traders studying value areas and market structure.
  • Gold (XAUUSD) Traders analysing auction behaviour and directional bias.
  • Index Traders trading instruments such as US30, NAS100, GER40, and other CFD indices.
  • Cryptocurrency Traders monitoring high-volatility markets using volume distribution and delta analysis.
  • Scalpers requiring objective intraday market structure and volume information.
  • Day Traders evaluating daily value areas and session-based opportunities.
  • Swing Traders analysing higher timeframe value distribution and trend development.
  • Price Action Traders combining volume profile with support, resistance, and market structure.
  • Smart Money Concepts (SMC) Traders studying BOS, CHoCH, liquidity sweeps, and value areas together.
  • Discretionary and Semi-Systematic Traders seeking transparent, evidence-based market analysis instead of black-box signals.

Optimal Configuration

AuctionFlow Structure supports all MetaTrader timeframes and works across Forex, Gold (XAUUSD), Indices, Cryptocurrencies, Stocks, Commodities, and other markets with tick or real volume.

  • Scalping: M1, M5, M15
  • Day Trading: M15, M30, H1
  • Swing Trading: H4, D1, W1
The indicator can be customized by adjusting the signal timeframe, history depth, decision engine thresholds, risk-to-reward requirements, dashboard size, and dashboard themes to match different trading styles and market conditions.


Final Notes

AuctionFlow Structure is a Volume Profile and Market Structure Indicator that combines Volume Profile, Delta Analysis, Market Structure, and a transparent decision engine into a structured technical analysis workspace. Rather than generating unexplained buy or sell signals, it evaluates multiple market factors and clearly explains the reasoning behind every trade ticket.

The indicator does not predict future price movements or guarantee trading results. It is designed to support market analysis, trade planning, and risk management, and is most effective when used alongside a trader's own experience, trading methodology, and independent analysis.
More from author
Candle Power Pro
Thushara Dissanayake
4.5 (8)
Candle Power Pro is a Volume Analysis Indicator  designed to analyze real tick volume , bull/bear pressure , buyer and seller imbalances , and price-volume relationships directly from the chart. The indicator transforms candle volume activity into a visual market analysis system by displaying bull and bear volume percentages , volume dominance, divergence conditions, and trend confirmation signals. Designed for Forex traders , Gold traders , Index traders , Cryptocurrency traders , scalpers , d
SMC Sessions MT5
Thushara Dissanayake
5 (2)
The SMC Sessions Indicator is a precision tool crafted for Smart Money traders who rely on ICT concepts, liquidity hunts, and session based strategies . It seamlessly maps out critical session based trading zones using the most proven and popular concepts used by institutional level traders. This all in one session indicator overlays your chart with the most effective and high probability range strategies, including: ICT Asian Range, London Breakout, New York Range, ICT London Open Killzone, ICT
Candle Volume Strength is an advanced volume analysis indicator that provides insights into the ongoing battle between buyers and sellers. It calculates and visualizes real time volume shifts, helping traders confirm breakouts, trends, retracements, and reversals with greater accuracy. Key Features: Volume Based Confirmation –   The indicator monitors tick volume changes and alerts when market power shifts between buyers and sellers. Trend and Breakout Validation –   By analyzing volume distri
The ICT NewYork Open Killzone Indicator is designed for traders who follow Smart Money Concepts (SMC) , ICT trading models , and liquidity based strategies in the Forex market . This tool marks the New York Open Killzone , spanning 11:00 to 14:00 GMT , a critical time when institutional volume often leads to major moves. The indicator highlights session ranges , market maker ranges , liquidity sweeps , FVG zones (Fair Value Gaps) , and breakout opportunities , providing a complete view of price
The London Session Breakout Strategy Indicator is designed for traders who follow ICT (Inner Circle Trader) and Smart Money Concepts (SMC) , focusing on session based liquidity hunts, killzones, and market maker behavior during the London session. This tool captures the highest and lowest price levels between 00:00 and 07:00 GMT , which is commonly identified as the London Killzone or market maker range . It helps traders identify potential breakout zones where institutional activity and volati
Breakout Robot
Thushara Dissanayake
5 (3)
The Breakout Robot EA is a specialized trading tool designed to automate time session-based breakouts . The EA operates by drawing a price range box and high/low lines according to the specified input time parameters. When price breaks above the high or below the low of this defined range, the EA automatically executes trades. The system's core functionality focuses on the EURJPY Breakout between 22:00-02:00 GMT, while its flexible architecture allows adaptation to other time-based strategies li
The Donchian Time Sync Analyzer brings powerful multi-timeframe dimension to classic Donchian channel analysis, allowing traders to simultaneously monitor trend strength and potential reversal signals across five different chart periods. This advanced indicator calculates the highest highs and lowest lows across your selected timeframes, generating clear visual signals that help identify convergence of trend direction across multiple time horizons. By providing coordinated analysis from minute t
NewYork Range MT5
Thushara Dissanayake
The New York Range Indicator is a session based analysis tool developed for traders applying ICT (Inner Circle Trader) concepts, Smart Money trading, and institutional price action methods . Designed specifically for the New York session, this indicator captures the price range between 12:00 and 14:00 GMT , a critical period that overlaps with the London Close and New York Open . It identifies session highs and lows , detects Fair Value Gaps (FVGs) , and highlights potential liquidity sweep zone
Smart Daily Fibonacci   is a   Daily Fibonacci Indicator for MT4 and MT5   that automatically draws   Fibonacci Retracement   and   Fibonacci Extension   levels using the previous trading day's high and low. Designed for   Forex traders ,   gold traders ,   index traders ,   cryptocurrency traders ,   scalpers ,   day traders ,   swing traders , and   prop firm traders , it helps create a structured daily trading framework without the need to manually draw Fibonacci tools every session. By trans
Candle GAP
Thushara Dissanayake
3 (1)
The Candle GAP indicator is an essential tool for traders utilizing Gap Trading Strategies as it automatically identifies candle gaps for each day of the week. A gap refers to a price level difference between the close and open of two consecutive days. This indicator recognizes four types of gap patterns: Common, Breakaway, Continuation, and Exhaustion. By incorporating this indicator into any chart, traders can validate their signals and enhance their trading decisions. One of the key features
FREE
Extract Candle Power
Thushara Dissanayake
5 (3)
Extract Candle Power is a real time volume extractor indicator that provides valuable insights into the behavior of sellers and buyers during each candle. By analyzing the volume data, traders can make more informed decisions about market trends and potential reversals, surpassing the capabilities of traditional Moving Average indicators. This powerful tool allows you to extract and analyze the sellers and buyers volume of the current candle, as well as compare it with the volume of previous can
Three MA Alert
Thushara Dissanayake
Triple MA Crossover Alert is a Moving Average Crossover Indicator  designed to analyze market direction using a combination of three moving averages: Fast MA , Normal MA , and Slow MA . The indicator helps traders identify changes in market trend , potential bullish and bearish conditions , and important price movement areas through a clear triple moving average structure. By combining technical analysis , trend analysis , and customizable trading alerts , this Forex Indicator provides a simple
Mr Fibonacci
Thushara Dissanayake
5 (1)
Introducing Mr. Fibonacci , an amazing indicator designed to simplify the process of drawing and adjusting Fibonacci levels on your chart. This indicator offers exceptional customization options for professional traders, allowing them to draw any Fibonacci level with precision. Additionally, it provides mobile notifications, email alerts, and pop-up alerts when price enters Fibonacci levels, ensuring you never miss potential trading opportunities. Using this indicator, you no longer have to cons
Two MA Crossover
Thushara Dissanayake
5 (3)
The Two MA Crossover is a powerful notification system designed specifically for traders who rely on the Moving Average Crossover Strategy . This fully automated indicator serves as a comprehensive alert system, ensuring that you never miss a crucial trading event. It sends notifications to your mobile device, email, and displays pop-up alerts with sound on your computer, all when it detects a moving average crossover based on your preferred parameters. One of its notable features is its compati
Pivot Bro
Thushara Dissanayake
5 (1)
Pivot Confluence Zones is a technical analysis indicator for MT4 and MT5 designed to identify retracement zones , reversal areas , and support and resistance levels by combining Pivot Points , Fibonacci Retracement , ATR , and ADR into a single trading workspace. Instead of relying on a single technical tool, the indicator searches for confluence zones where multiple trading levels overlap, helping traders evaluate areas that may attract increased market attention. To strengthen price analysis,
ReversalPatterns
Thushara Dissanayake
This technical indicator automatically identifies and analyzes price action using a variety of Reversal Candlestick Patterns on the chart. It conveniently draws arrow signs along with the corresponding pattern names, making it easy to spot the latest reversal candlestick patterns. With this indicator, you can quickly identify and compare chart analysis with previously identified candle patterns. The indicator includes a range of implemented candlestick patterns, both simple and complex, such as
Reversal Alert Pro
Thushara Dissanayake
2.5 (2)
The Reversal Alert Pro indicator is a powerful tool designed to automatically detect reversal areas in the market. It offers convenient notifications sent directly to your mobile device and displays pop-up alerts with sound. By incorporating this indicator into your trading strategy, you can effectively filter trade positions. Furthermore, the indicator provides the option to utilize CCI, RSI, and Stochastic indicators to further refine the generated signals, enhancing its versatility and applic
Currency Strength 7
Thushara Dissanayake
The Currency Strength 7 technical indicator is a powerful tool designed to help traders gauge the strength of the seven most popular currencies. By analyzing the strength of AUD, USD, EUR, GBP, JPY, CHF, and CAD, this indicator provides valuable insights into currency dynamics. It represents currency strength on the chart using lines, allowing traders to quickly assess the relative strength of different currencies. One of the standout features of this indicator is its ability to draw an extended
BullsBears Action
Thushara Dissanayake
The BullsBears Action Expert Advisor is an advanced trading solution designed for traders who rely on volume based market analysis. Utilizing Bulls and Bears volume data, this EA automatically identifies potential trade opportunities based on market strength and executes Buy or Sell orders according to user defined parameters. It is fully customizable, allowing traders to fine tune their strategies with multiple filters, risk management options, and trade execution controls. This EA includes an
Crossover Action
Thushara Dissanayake
The Crossover Action Expert Advisor is an advanced tool designed to automate one of the most popular trading strategies, the M oving Average Crossover Strategy . With its intuitive interface and powerful features, this expert advisor takes the complexity out of manual trading and executes trades automatically based on moving average crossovers. One of the key features of this expert advisor is its proper risk management system, ensuring that trades are executed with appropriate lot sizes and max
CCI Action
Thushara Dissanayake
The CCI Action Expert Advisor is a powerful tool designed to automate the CCI (Commodity Channel Index) Strategy , allowing traders to capitalize on CCI level touches. With its user friendly settings and robust risk management system, this EA provides a reliable and efficient solution for traders looking to incorporate the CCI indicator into their trading approach. One of the key features of this Expert Advisor is its proper risk management system, which helps traders maintain control over their
News Robo
Thushara Dissanayake
2 (1)
The News Robo Expert Advisor is a powerful tool designed to assist news traders in opening pending orders with hidden stop loss during news releases. It offers several features that enhance your trading experience and protect your trades. One of the key features of News Robo is the hidden stop loss, which is ideal for news traders who prefer to conceal their stop loss from market maker brokers. The stop loss is automatically revealed once a profitable position is achieved, allowing you to secure
RSI Action
Thushara Dissanayake
3.67 (3)
The RSI Action Expert Advisor is a powerful tool that automates popular RSI (Relative Strength Index) strategies, allowing for efficient and accurate trading. By utilizing overbought and oversold levels, this EA identifies optimal entry points for buy and sell orders. It also offers various signal filtering options to enhance trading precision, including RSI reversal points, pending orders, major trend identification, and Moving Average Crossover signals. Additionally, it incorporates a modern
Fibo Scalper Pro
Thushara Dissanayake
2.33 (3)
The Fibo Scalper Pro Expert Advisor is a powerful tool designed to automate popular Fibonacci Trading Strategies . It simplifies the trading process by automatically drawing and adjusting Fibonacci levels on the chart. This feature provides convenience and accuracy for traders who utilize Fibonacci retracements and extensions in their analysis. One of the key features of the Fibo Scalper Pro is its customization facility. It allows professional traders to enable or disable each Fibonacci level
TPSL Driver
Thushara Dissanayake
Introducing the TPSL Driver Utility , a powerful tool designed to enhance your trading experience by automating Stop Loss and Take Profit management. This utility caters to every trader who desires seamless order management and advanced profit protection techniques. With the TPSL Driver Utility, you have the flexibility to choose between two modes of order management: Hidden and Visual. The Hidden mode allows you to hide the Take Profit and Stop Loss levels, providing a discreet approach to mana
Entry Point
Thushara Dissanayake
The   Entry Point   indicator is a   professional signal dashboard   that combines multiple technical indicators across up to three timeframes to produce a single   consolidated entry signal . Rather than juggling separate windows for Moving Averages, CCI, RSI, Stochastic, Bill Williams Accelerator, and volume analysis, traders can view all these readings in one   intuitive visual panel . The system analyzes each timeframe independently, then applies   weighted voting   based on your chosen prio
Entry Point Dashboard Ultimate
Thushara Dissanayake
4 (5)
Entry Point Dashboard Ultimate is a Multi-Timeframe Trading Dashboard Indicator for MT4 and MT5 designed to simplify technical analysis , market trend analysis , and entry point identification by combining multiple trading tools into a single visual dashboard. The indicator analyzes Moving Averages , CCI , RSI , Stochastic , momentum data, and volume conditions across selected timeframes to create a structured overview of current market conditions. Designed for Forex traders , Gold traders , Ind
Introducing the Fibo Channels Ultimate technical indicator, a powerful tool designed to revolutionize your Fibonacci trading strategy. With its advanced functionality, this indicator automatically draws all past Fibonacci channels on your chart, saving you time and effort. What sets the Fibo Channels Ultimate apart is its exceptional customization capabilities, allowing professional traders to draw any Fibonacci level they desire. This level of flexibility ensures that you can tailor the indicat
The Crossover Tactics Ultimate Expert Advisor is a powerful tool designed to automate popular Moving Average Crossover Strategies . It excels at identifying optimal entry points based on the intersection of three moving averages, while employing advanced filtering techniques to enhance the reliability of signals. However, what sets this EA apart is its comprehensive trade management system, known as the TPSL Driver Utility algorithm. One of the standout features of this expert advisor is its abi
Introducing the DFP Reconnoiter Ultimate , a technical indicator specifically designed for Daily Fibonacci Pivot Strategy traders. This indicator incorporates standard Fibonacci retracements, daily Pivot levels, Candlestick patterns, ATR and ADR levels to identify reversal and exit areas, resulting in well-timed entries. Key Fibonacci retracement levels of 38.2%, 50.0%, or 61.8% are preferred in conjunction with the daily central pivot. The strategy involves monitoring the Average True Range (AT
Filter:
No reviews
Reply to review