Scanner for news event and economic calendar
- Experts
-
Mark Nicole Olarte
 Perché lavorare con me? Non scrivo solo codice — costruisco soluzioni di trading che funzionano. Con anni di esperienza pratica nell'ecosistema MetaTrader, mi specializzo nel trasformare strategie di trading complesse in sistemi completamente automatizzati che operano per te 24/5.
 - Versione: 3.0
- Aggiornato: 22 marzo 2026
- Attivazioni: 5
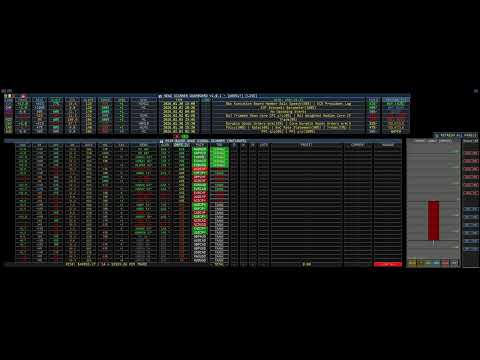
DASHBOARD STATISTICA MT5 PER LO SCANNER DI NOTIZIE, EVENTI E CALENDARIO ECONOMICO
La prima dashboard statistica per MT5 progettata per scansionare eventi e calendari economici utilizzando la probabilità matematica.
I SETTE PILASTRI: I COMANDAMENTI DEL PROFITTO Questo sistema non si limita a guardare le notizie; analizza la scienza delle reazioni del mercato attraverso sette pilastri d'élite:
-
Power (Matematica) Questo è il battito cardiaco del mercato. Utilizzando un calcolo proprietario del "Net Score", il sistema sintetizza il momentum complesso in un unico numero. Vedrai lo spostamento del potere prima ancora che la candela finisca. Analisi Tecnica: Il motore identifica ogni evento economico della settimana e lo incrocia con un buffer mobile di 3 anni di bias istituzionali. Se un evento ha un bias rialzista storico del 74%, viene moltiplicato per il suo peso di impatto (Alto, Medio o Basso). Il Net Score è la somma matematica di tutti i pesi assegnati per la settimana.
-
Beat Percentage (Percentuale di Superamento) Il pilastro Beat traccia con quanta intensità i dati reali di una valuta superano le aspettative del mercato. Analisi Tecnica: Questa metrica traccia il momentum della sorpresa. Confronta i dati reali con il consenso degli analisti (Forecast). Se 8 report su 10 sono stati superiori alle attese, la percentuale di Beat è dell'80%, indicando che la valuta è in una fase di superamento economico (Economic Beat Phase).
-
W-Hit (Tasso di Successo) Il Win-Hit rate è uno scudo di probabilità. Indica la percentuale esatta di eventi storici che hanno portato a un movimento profittevole. Analisi Tecnica: Il motore scansiona le ultime 12 settimane di dati storici e verifica se il bias identificato ha effettivamente portato alla chiusura di una candela nella stessa direzione. Un tasso di successo del 75% indica che il mercato sta rispettando i fondamentali di quella valuta.
-
Dev (Deviazione) La deviazione misura la volatilità o il "carburante" del profitto. Una deviazione alta indica movimenti esplosivi, mentre una bassa suggerisce un mercato calmo. Analisi Tecnica: Misura il raggio d'esplosione. Calcola il divario matematico tra il Forecast e il risultato Reale negli ultimi 6 mesi di notizie ad alto impatto. Un punteggio elevato identifica quale valuta ha maggiori probabilità di produrre gap rapidi.
-
W-ATR (Volatilità) Il contesto di mercato è tutto. Questo pilastro traccia l'attuale Average True Range (ATR) rispetto alle medie storiche. Analisi Tecnica: Utilizza 12 candele settimanali per calcolare il movimento medio. Confrontando il movimento attuale con questa media a lungo termine, rivela quanta "benzina c'è nel serbatoio" per una potenziale espansione.
-
Sync Percentage (Percentuale di Sincronizzazione) Il Sync misura quanto perfettamente una valuta si muove in correlazione con il suo paniere. Analisi Tecnica: Calcola il consenso istituzionale pesando la direzione di tutti gli eventi previsti per la settimana. Se una valuta ha diversi eventi di acquisto ad alto impatto e zero eventi di vendita, il Sync è del 100%, indicando una pressione fondamentale unanime.
-
Streak (Serie) Il momentum è come un treno merci. Il pilastro Streak conta le candele vincenti consecutive per confermare il supporto del trend. Analisi Tecnica: Scansiona le ultime 10 candele settimanali. Una serie positiva (es. +4) conferma il supporto istituzionale, mentre una serie estrema (+5 o più) avverte di una potenziale estensione eccessiva.
COLONNE DELLA DASHBOARD: IL TUO RADAR A 360 GRADI
-
Curr: Identificazione della valuta con codice colore per un riconoscimento istantaneo.
-
News: Conteggio preciso degli eventi ad Alto, Medio e Basso impatto.
-
Time: Un conto alla rovescia di precisione per il prossimo evento importante.
-
Link: Confluenza istituzionale che mostra dove i "grandi capitali" stanno accumulando scommesse.
-
History: Una finestra scorrevole di ogni Beat (Superamento) e Miss (Mancato) registrato.
-
Edge Percentage: Il tuo vantaggio statistico; punteggi superiori al 70% indicano probabilità elevate.
-
Outlook: Un riepilogo professionale del sentiment generale.
IL PAIR SCANNER: MATCHMAKING PER IL PROFITTO Il Pair Scanner abbina automaticamente le valute più forti alle più deboli.
-
Alignment: Verifica se i timeframe H1, D1 e W1 puntano nella stessa direzione.
-
Confluence Percentage: Combina tutti i 7 pilastri in un unico punteggio finale.
-
Trade Stats: Monitoraggio in tempo reale delle prestazioni giornaliere, settimanali e mensili.
-
Management: Pulsanti di precisione istantanea per l'esecuzione e il copia-trading.
PANNELLO DELLA CANDELA ATTUALE E FILOSOFIA DELLA CANDELA SINGOLA Concentra tutta la tua attività di trading sul progresso della candela settimanale attuale. Questo pannello elimina l'affaticamento da grafici focalizzandosi su un singolo movimento e una singola espansione.
-
Visual Pulsing: Osserva il prezzo bid mentre pulsa all'interno del corpo della candela.
-
Professional Design: Un design istituzionale che rende chiaro ogni movimento.
-
Strategic Focus: Invece di monitorare più timeframe, catturi l'espansione settimanale e concludi il lavoro per la settimana.
PROGETTATO PER LA PRESERVAZIONE DEL CAPITALE Si tratta di un sistema completo di gestione del rischio progettato per proteggere il tuo capitale:
-
Smart Lot Division: Calcola automaticamente la dimensione del lotto in base al saldo.
-
Hard Stop Losses: Ogni setup include una rete di sicurezza pre-calcolata.
-
Statistical Filtering: Il sistema rimane fermo quando i punteggi di probabilità sono bassi.
-
Dynamic Confluence: Richiede più punti di allineamento prima di generare un segnale.
Avvertenza sui rischi: Il trading nei mercati finanziari comporta rischi significativi. Nessun sistema può garantire profitti. Utilizza gli strumenti forniti per operare in modo responsabile.


I bought this indicator. At first glance, it looks very professional, but there is no manual. For some pairs, it shows a test trade in green, and when you click on it, a position is opened. However, it doesn’t say anywhere when you should open a position. I am still waiting for a proper guide.