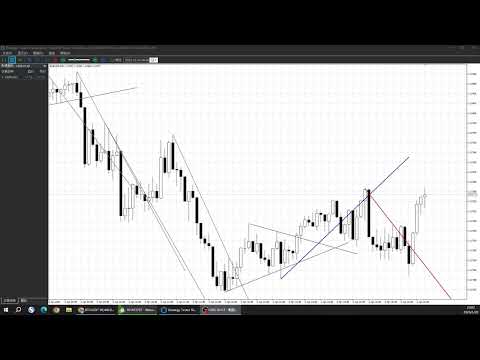
Wyckoff Smart Trendlines
- Indicators
- Version: 1.0
- Activations: 10

Auto Trendline Support & Resistance
Are the trendlines you draw truly confirmed by the market?
If a trendline exists only because you feel “this looks like a low,”
then it is closer to a subjective guess than a market structure.
The goal of Wyckoff Smart Trendlines is very clear:
to draw only trendlines that have been confirmed by market structure.
Part 1|Why This Trendline Is Different from What You’ve Used Before
Most automatic trendline tools on the market follow a very simple logic:
they identify local highs or lows and connect them directly.
The problem is that these points are often not confirmed by a complete market structure.
The result is:
-
Too many trendlines
-
A cluttered chart
-
Very few lines that truly matter
The core philosophy of Wyckoff Smart Trendlines can be summarized in one sentence:
A trendline must be built on structure that has already been confirmed by the market.
This indicator does not attempt to predict future price movement,
nor does it force trends to appear during ranging markets.
It only draws support and resistance trendlines after price has completed a valid structure.
The result:
-
A cleaner chart
-
Fewer trendlines, but higher quality
-
Every line is derived from actual market behavior
If you are tired of drawing countless lines and still lacking confidence to enter trades,
this logic may suit you very well.
Part 2|How the Indicator Works (Structural Trendline Logic)
1. Structure-Confirmed Pivot Points
This indicator uses Pivot High / Pivot Low as the structural foundation.
A high or low is recognized as a valid structural pivot only after price structure on both sides is completed.
Any price fluctuation that is not structurally confirmed will not be used to draw trendlines.
This means:
every trendline you see is based on market-confirmed structure, not subjective assumptions.
2. Rising Trendlines
When the market forms:
-
Confirmed structural lows
-
And each subsequent low is higher than the previous one
the indicator automatically connects these structural lows
and extends a rising trendline to the right.
This line represents the market’s willingness
to complete pullbacks and absorption at progressively higher levels.
3. Falling Trendlines
The same logic applies to bearish structures:
-
Confirmed structural highs
-
And each subsequent high is lower than the previous one
the indicator automatically draws a falling trendline
as a reference for structural resistance.
4. Differentiating Current and Historical Structures
To avoid excessive chart complexity, the indicator automatically distinguishes between:
-
Newly formed trendlines
-
Historical trendlines that have been replaced by new structure
The most recent trendlines are displayed with stronger visual emphasis,
while historical ones are visually de-emphasized.
This ensures your focus remains on the most relevant current market structure.
5. Built-in Ranging Market Filter
In ranging conditions, the practical value of trendlines drops significantly.
This indicator compares short-term ATR with long-term ATR
to determine whether the market is in a low-volatility, non-trending state.
When the market is identified as ranging:
-
Trendline drawing is heavily filtered
-
Meaningless trendlines in sideways markets are avoided
As a result, trendlines appear primarily in markets
that exhibit genuine directional movement.
Part 3|Parameter Explanation
Lookback Period
Defines the number of bars required on both sides to confirm a structural pivot.
-
Smaller values: more responsive structure, more trendlines
-
Larger values: more stable structure, fewer trendlines
Recommended settings:
-
Lower timeframes: 2–3
-
Higher timeframes: 3–5
Projection Length
Controls how far the trendline is extended to the right.
This affects visual display only and does not influence calculation logic.
Recommended:
-
Intraday trading: 15–30
-
Swing trading: 30–60
Filter Style (Ranging Filter Mode)
-
Sensitive: Suitable for lower timeframes; draws structure as soon as it appears
-
Balanced (Recommended): A balance between responsiveness and stability
-
Strict: Keeps only the clearest structures; suitable for higher timeframes or structural traders
Custom ATR Parameters (Advanced)
Effective only when Custom is selected:
-
Short ATR / Long ATR: Used to evaluate current volatility conditions
-
ATR Ratio: Higher values apply stricter ranging-market filtering
-
Min Slope ATR: Filters out overly flat, directionless trendlines
If you are not familiar with these parameters,
it is recommended to use the preset styles, which are optimized for live trading.
Part 4|How to Use These Trendlines in Live Trading (Important)
Wyckoff Smart Trendlines is not a trading signal indicator.
Its purpose is to help you determine
whether the market is still operating within a confirmed structural trend.
In live trading, these structural trendlines are commonly used for:
1. Validating Structure
-
Whether price continues to respect the trendline
-
Whether a structural break or breakout occurs
2. Pullback and Absorption Reference
-
In uptrends: whether pullbacks are absorbed at structural support
-
In downtrends: whether rebounds are rejected at structural resistance
3. Combination with Other Tools
-
Momentum indicators (e.g., MACD, RSI)
-
Volume or Wyckoff-based behavior analysis
-
Your existing entry models or EA logic
Please note:
this indicator is responsible only for structural validation.
It does not define specific entry, stop-loss, or take-profit rules.
Different traders may build entirely different, yet internally consistent,
trading approaches based on the same structural trendlines.
Part 5|Free Demo Usage (Important)
Please note:
MQL5 demo indicators cannot be attached to charts in the same way as full versions.
Please follow these steps exactly:
-
Click Download Demo on the MQL5 Market page
-
Open the MT5 terminal
-
Press Ctrl + R to open the Strategy Tester
-
Select Indicator as the test type
-
Choose Wyckoff Smart Trendlines (Demo) from the indicator list
-
Select any symbol and timeframe, then click Start
-
Once the test begins, the chart will open automatically and the indicator will load correctly
This is the official MQL5 demo usage method.
Suitable Users
This indicator is suitable for:
-
Traders who analyze markets based on structure
-
Users who do not rely on buy/sell arrows and prefer independent decision-making
-
Forex, indices, crypto, and stock CFD traders
Not suitable for:
-
Users who are only looking for instant trading signals