Custom Signal Scanner MT5
- Indicators
- Satya Prakash Mishra
- Version: 1.1
- Updated: 29 August 2025
- Activations: 5
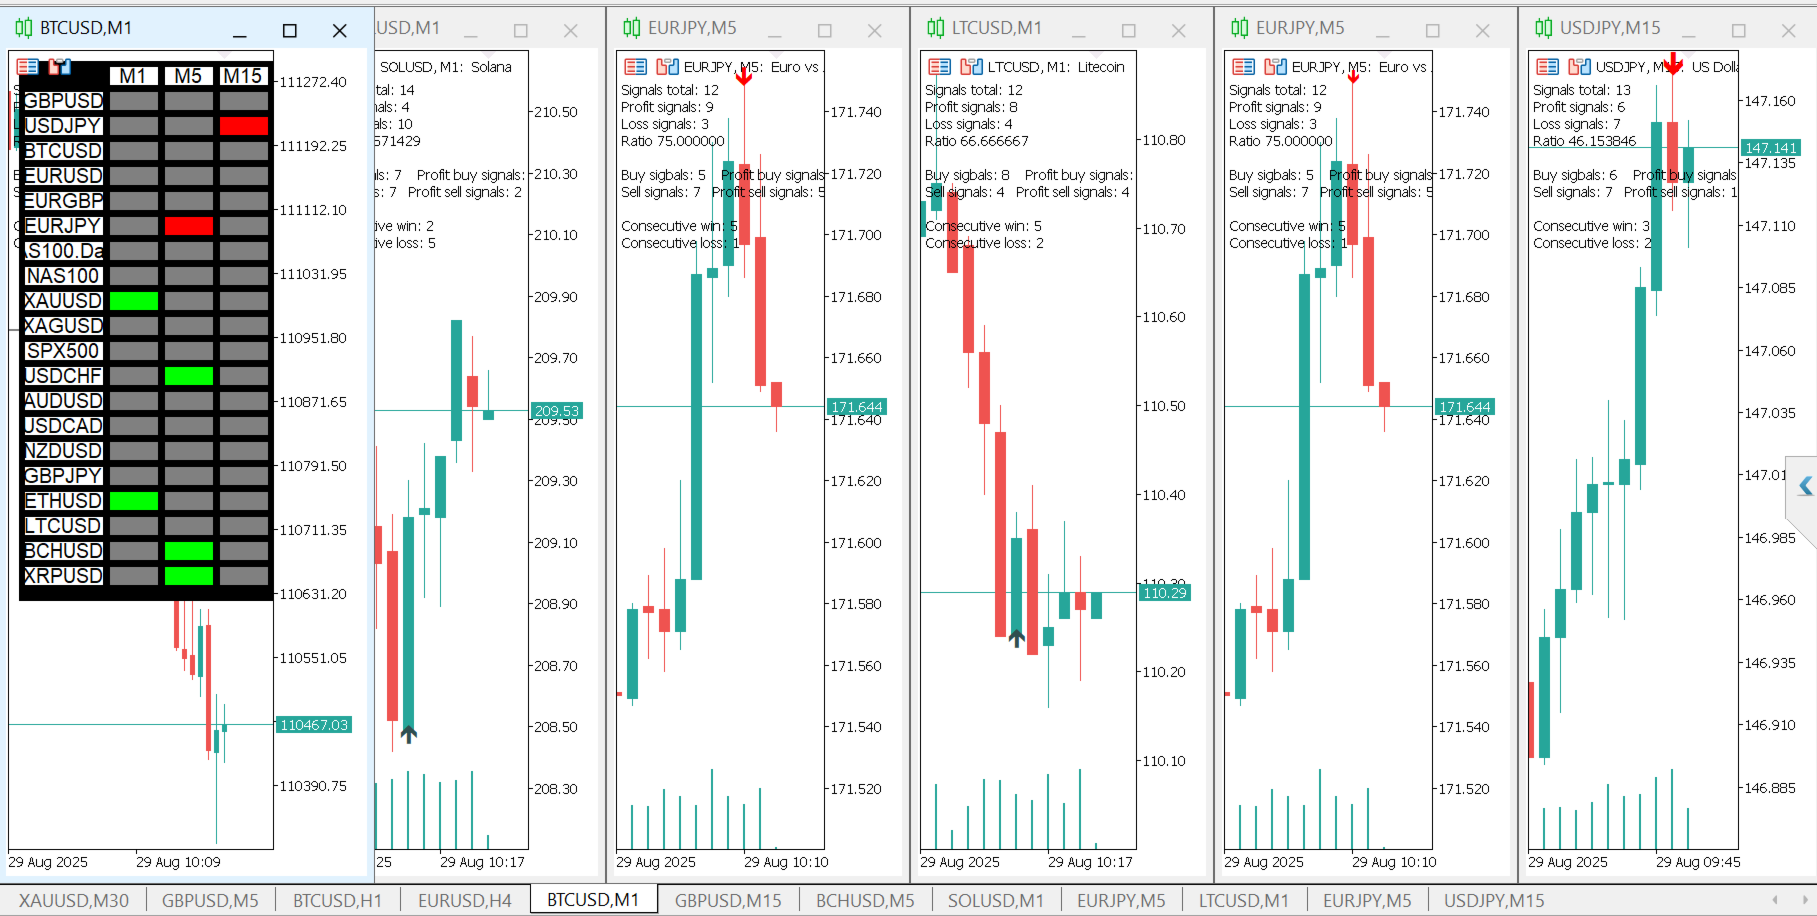
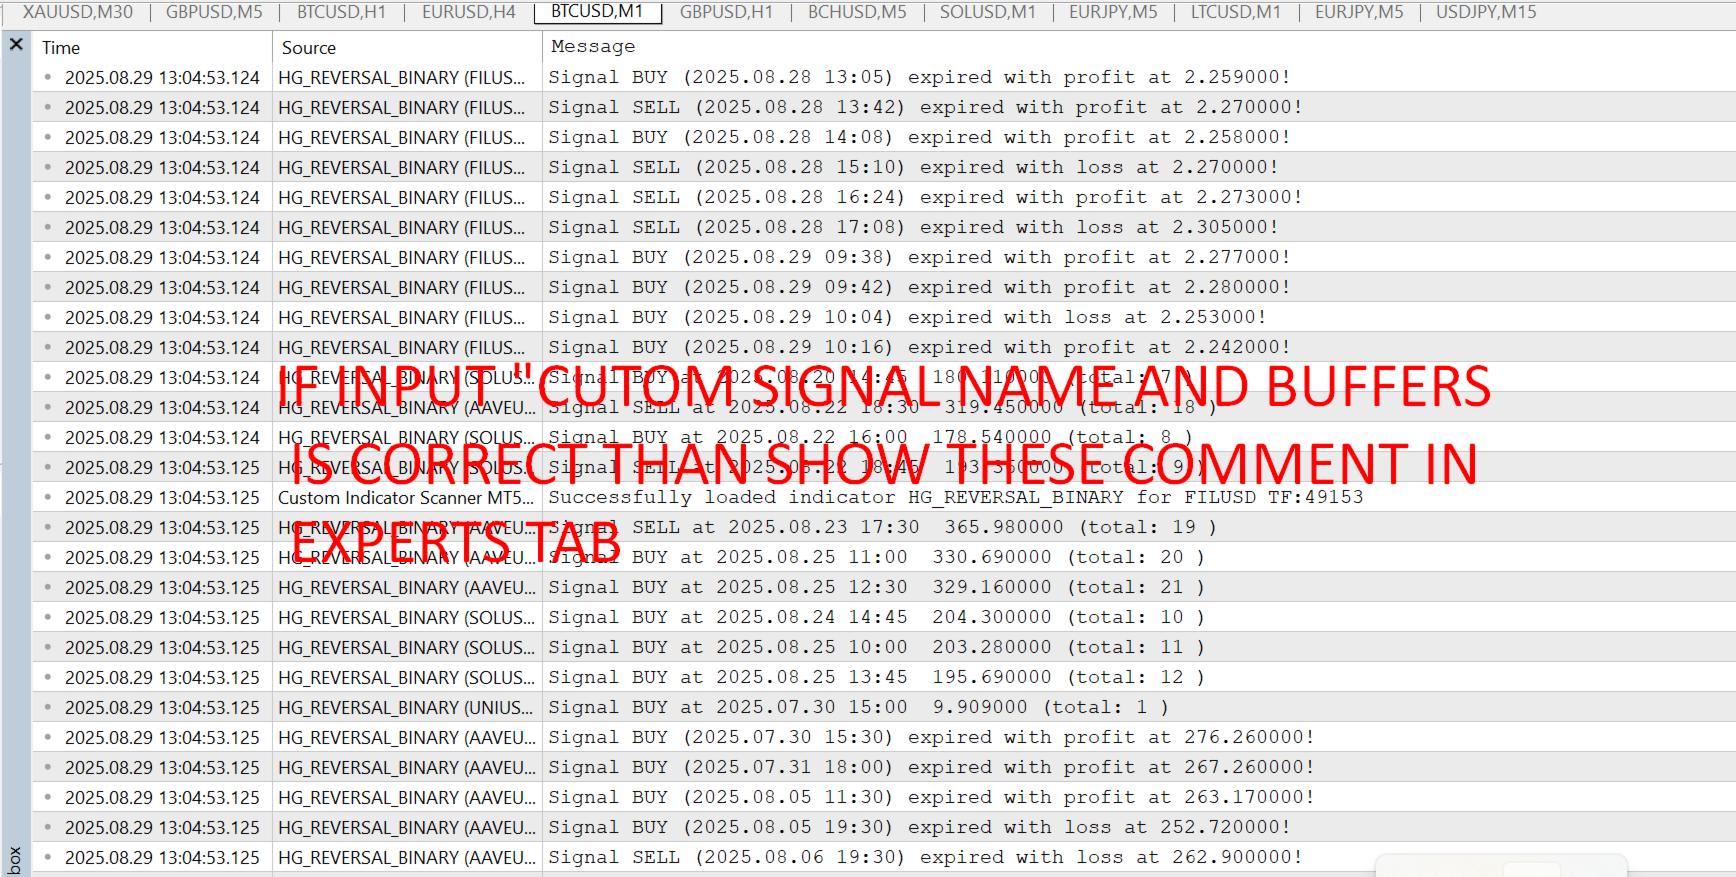
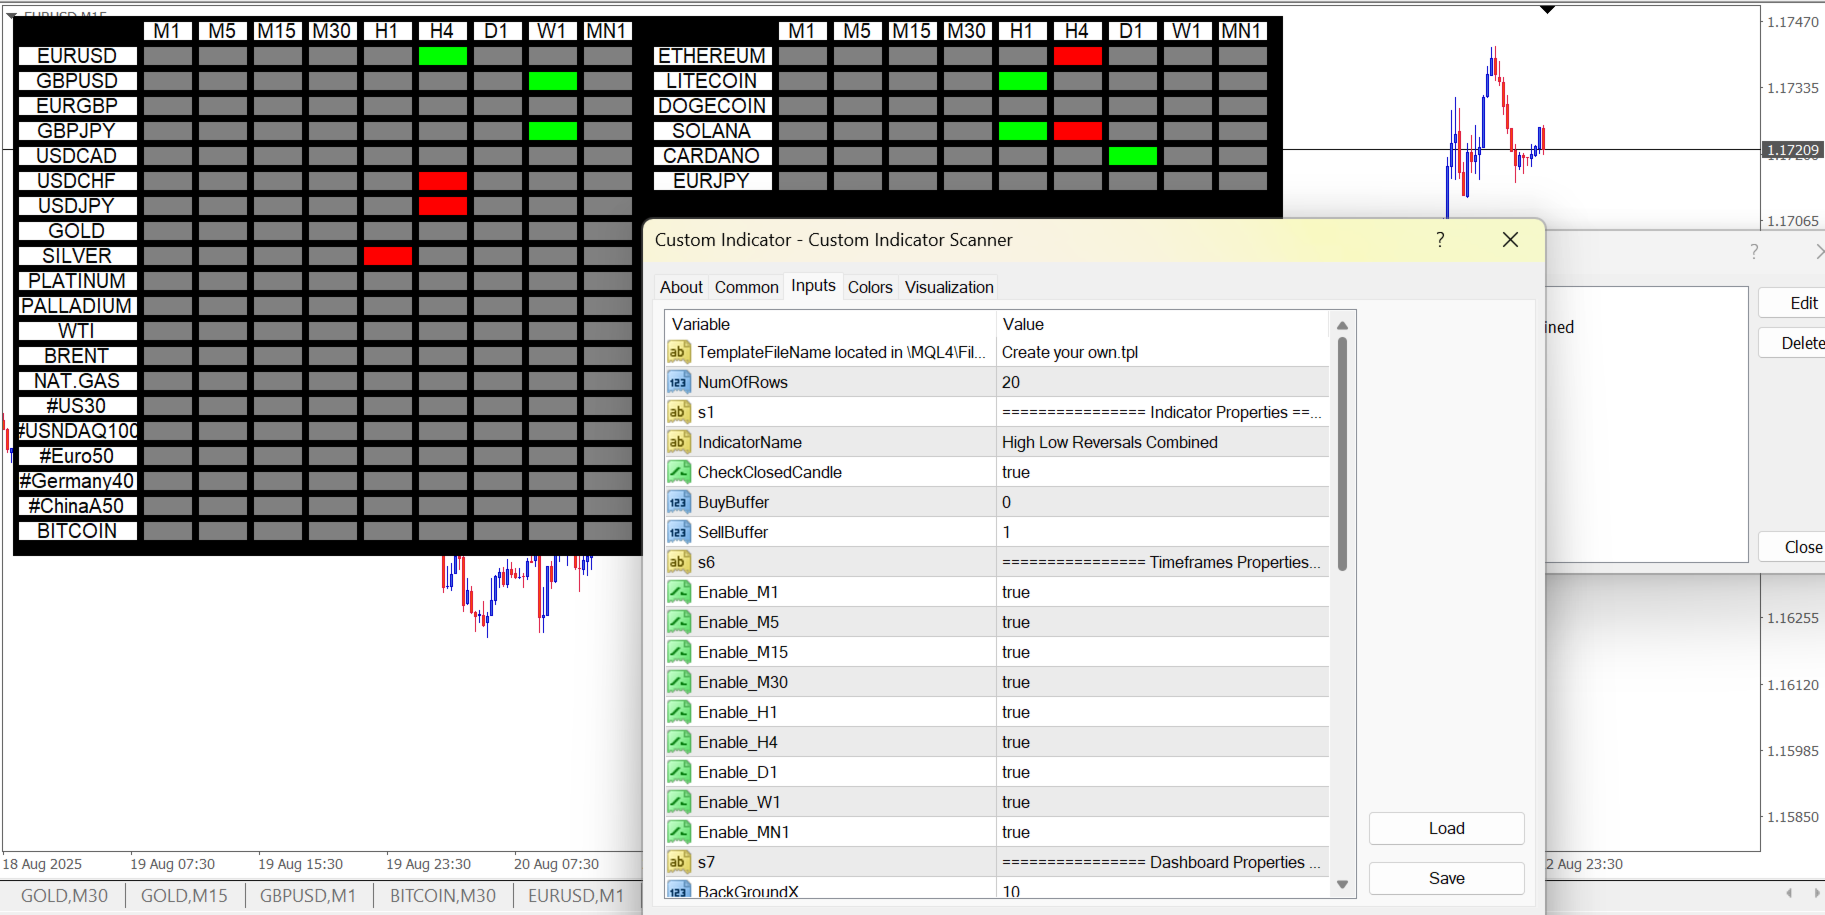
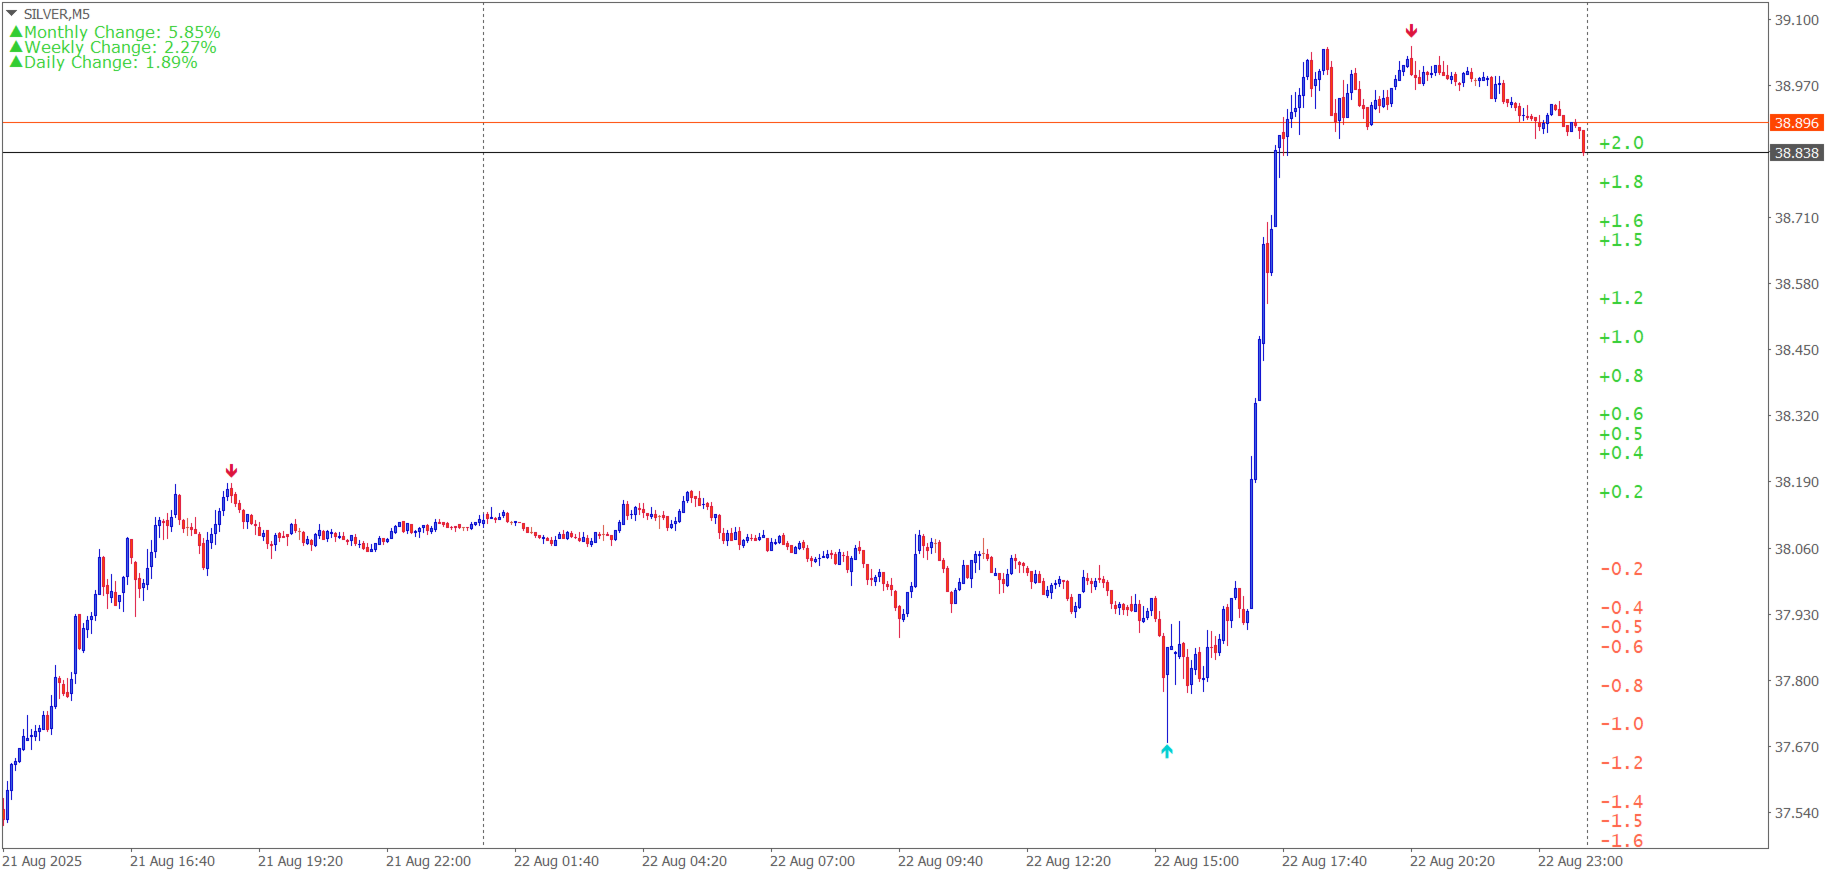
Custom Indictor Signal Scanner for scan your own any custom indicator and template its one click you can open your desire signals(given time frame alert).
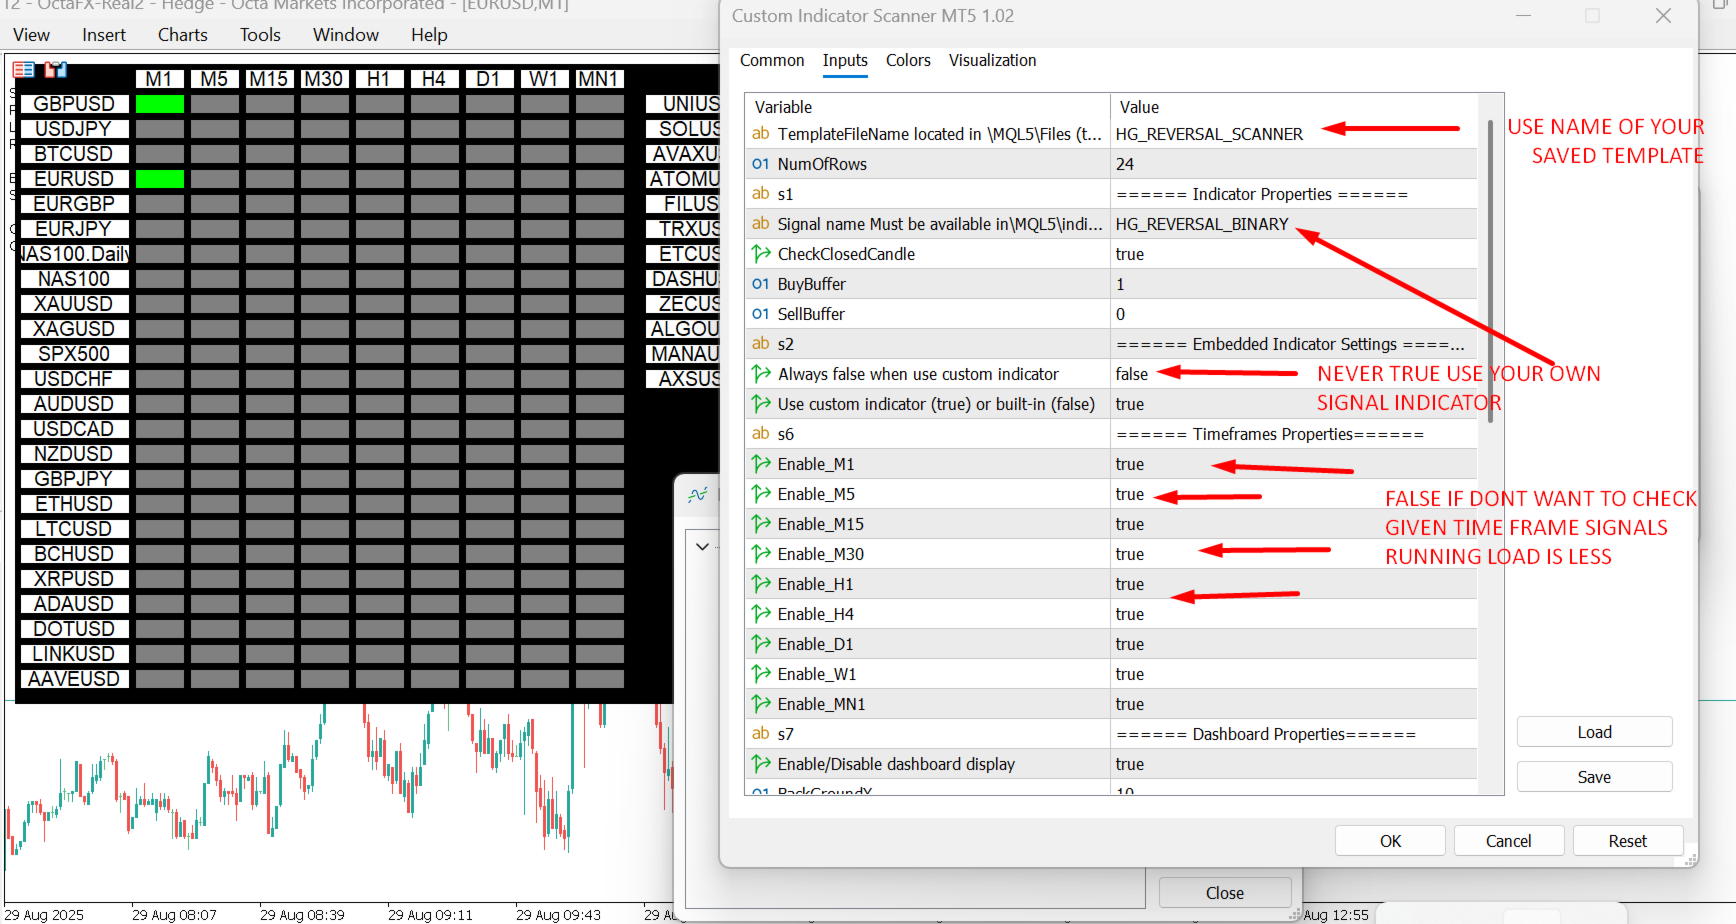
Also can open same template with particular input indicator just type name of template your created with given indicator and enjoy all time frame scan with your logical signals
input string s2 = "====== Embedded Indicator Settings ======";
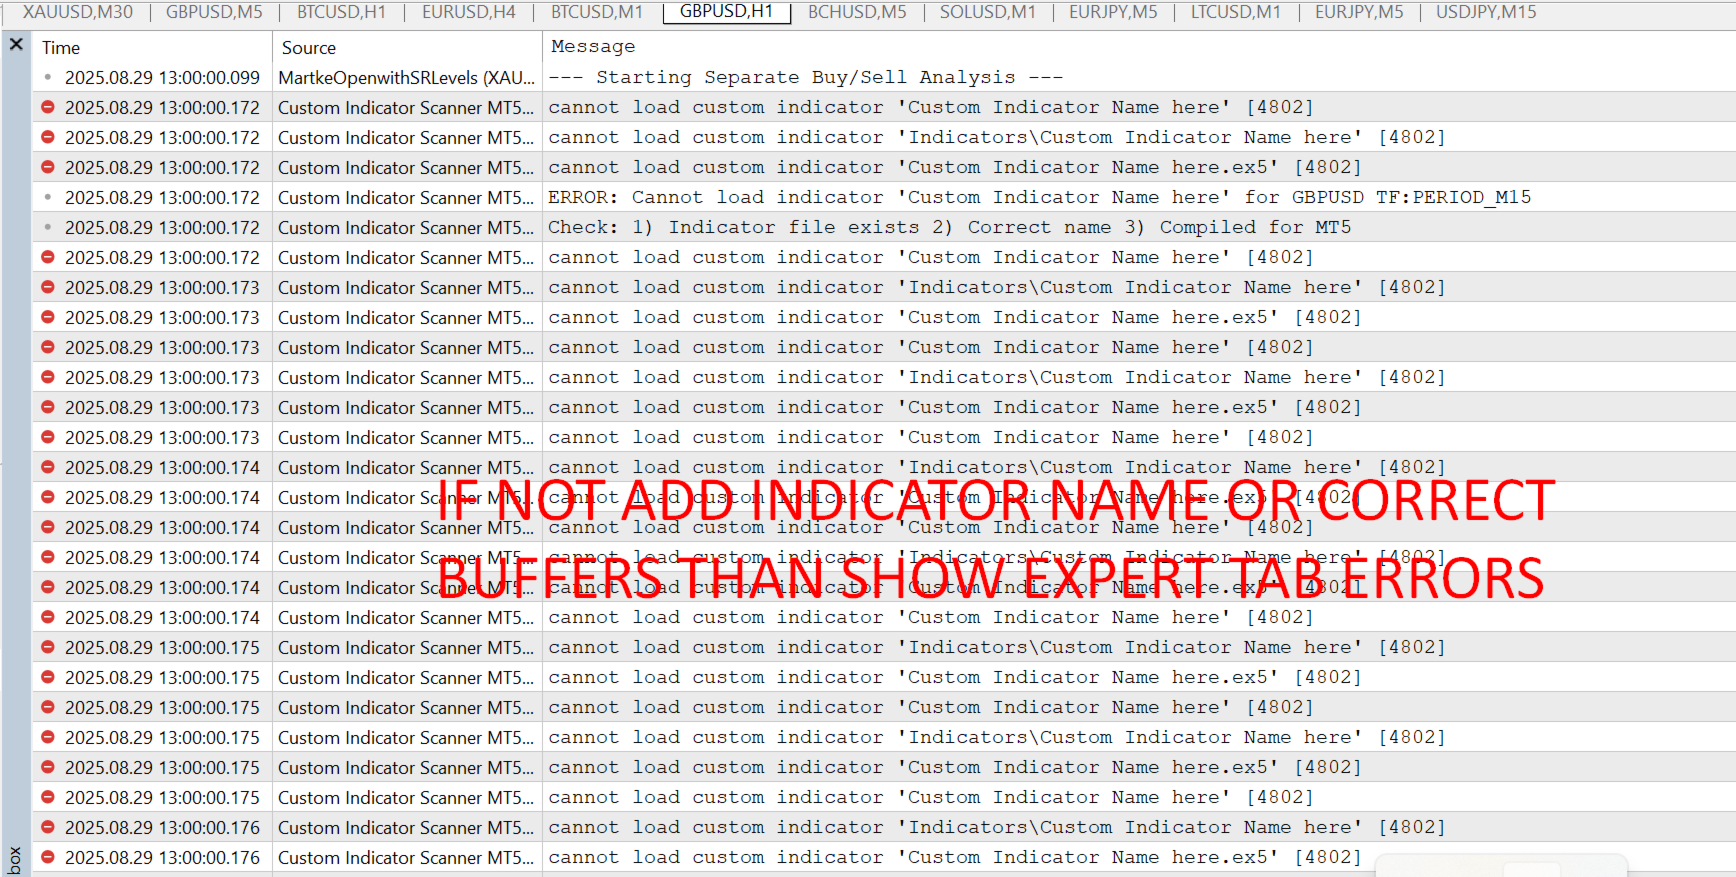
input UseEmbeddedIndicator = false; // Use embedded indicator instead of external file ( don't use its not signal use false alwsy and add your own)
input UseCustomIndicator = true; // Use custom indicator (true) when you enter your indicator name.
What is a Custom Indicator Scanner for MT5
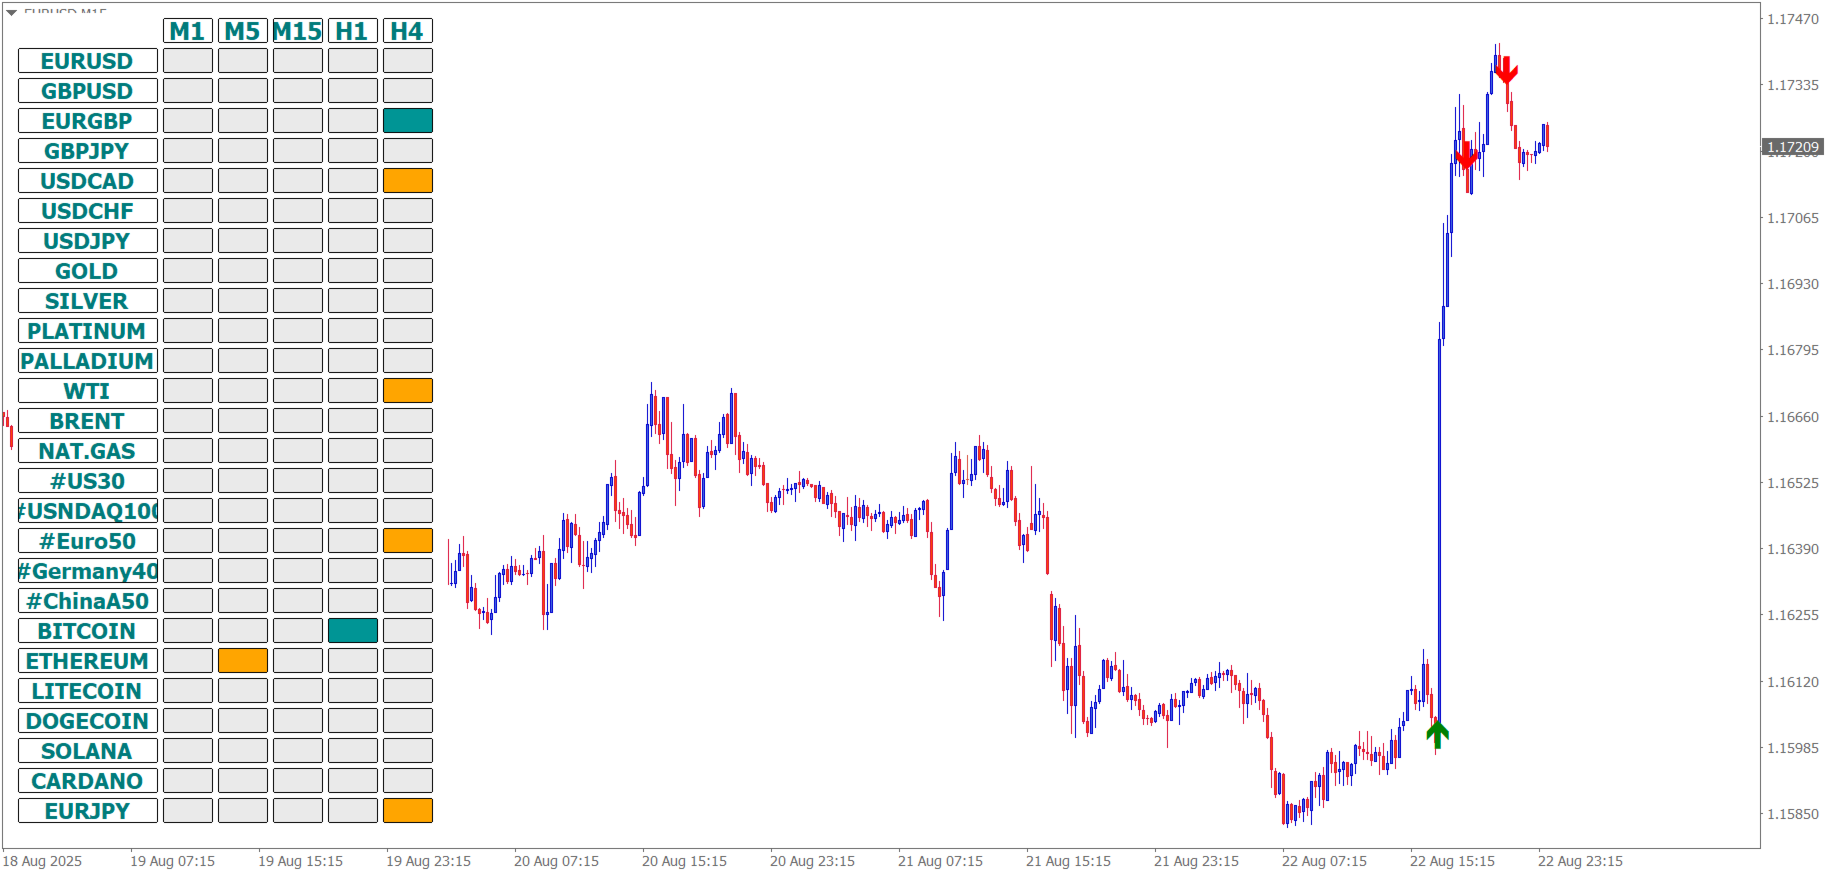
A custom indicator scanner is an Indicator or script that automatically scans multiple currency pairs and timeframes for specific indicator conditions, saving traders time from manually checking charts.
Key Components
Scanner Types:
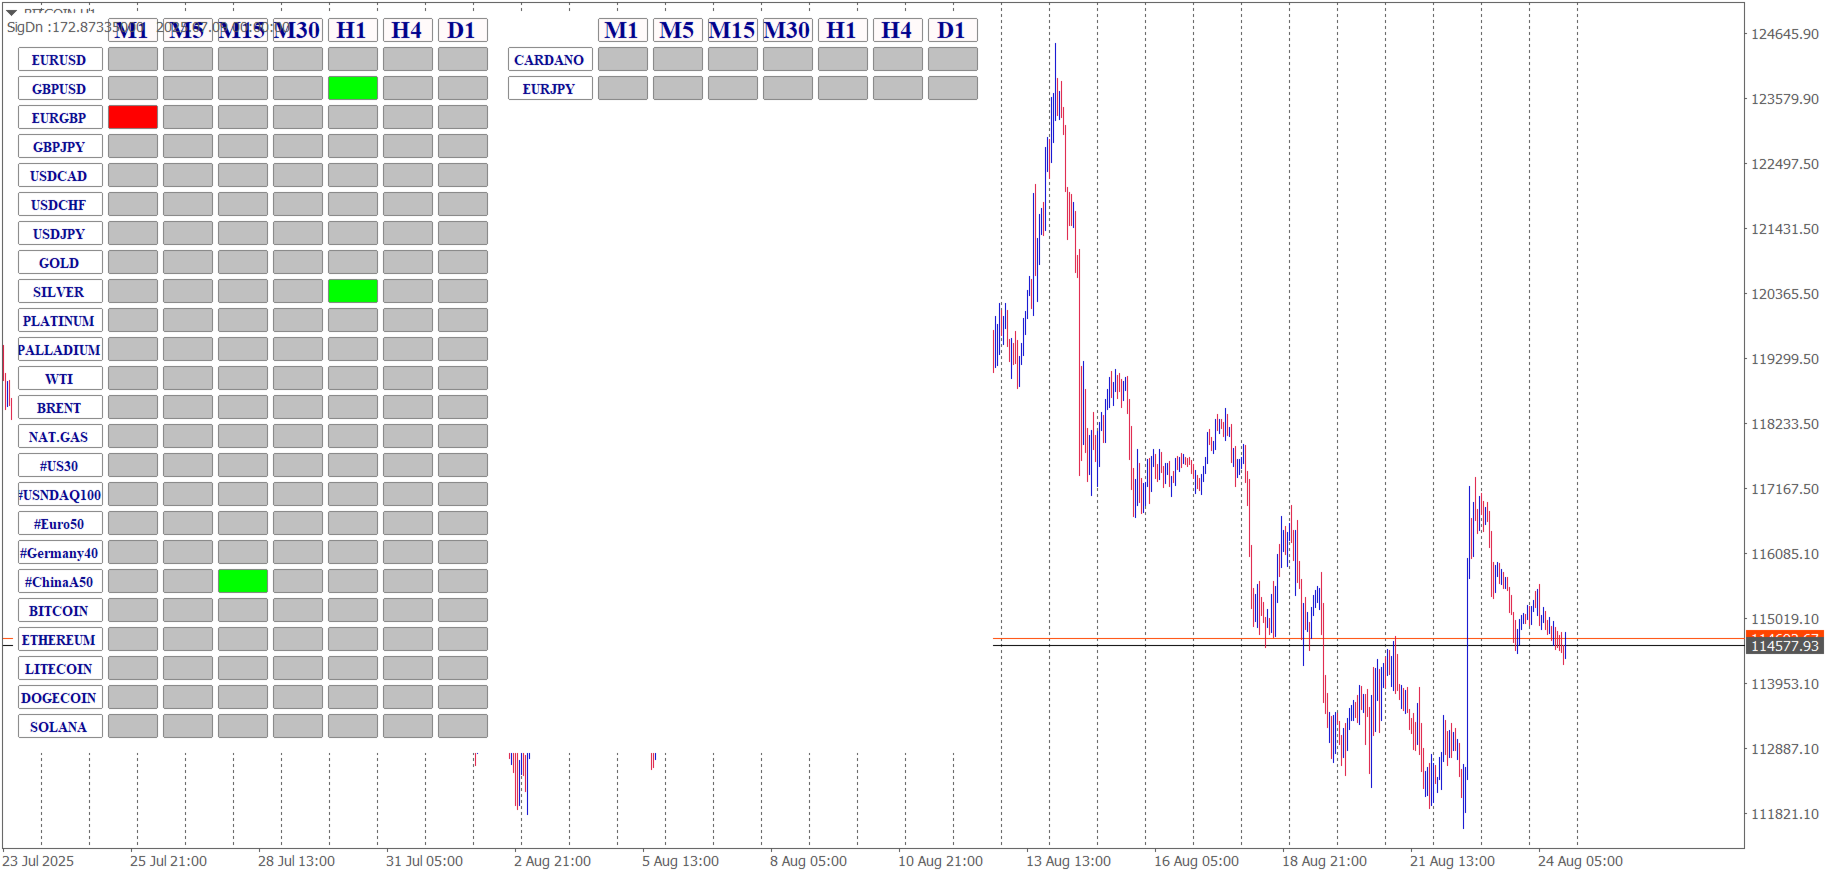
- Market scanner - monitors multiple symbols simultaneously
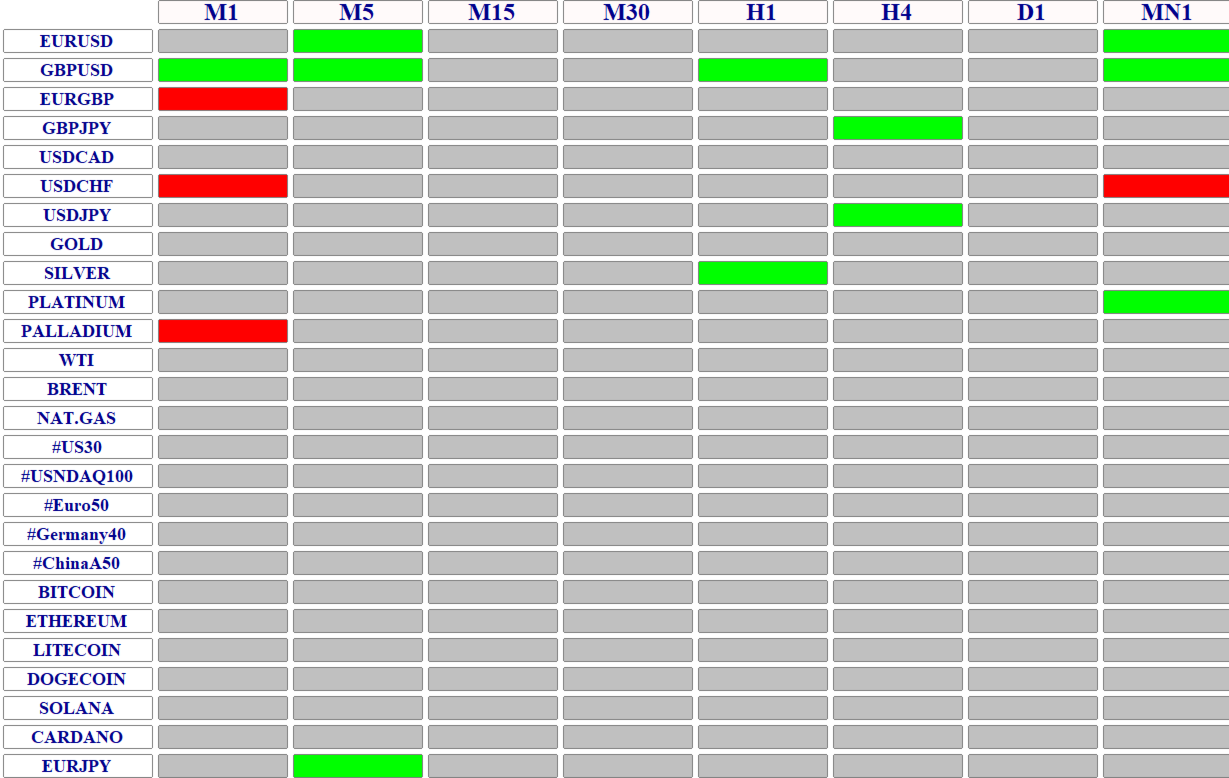
- Multi-timeframe scanner - checks different timeframes on one symbol
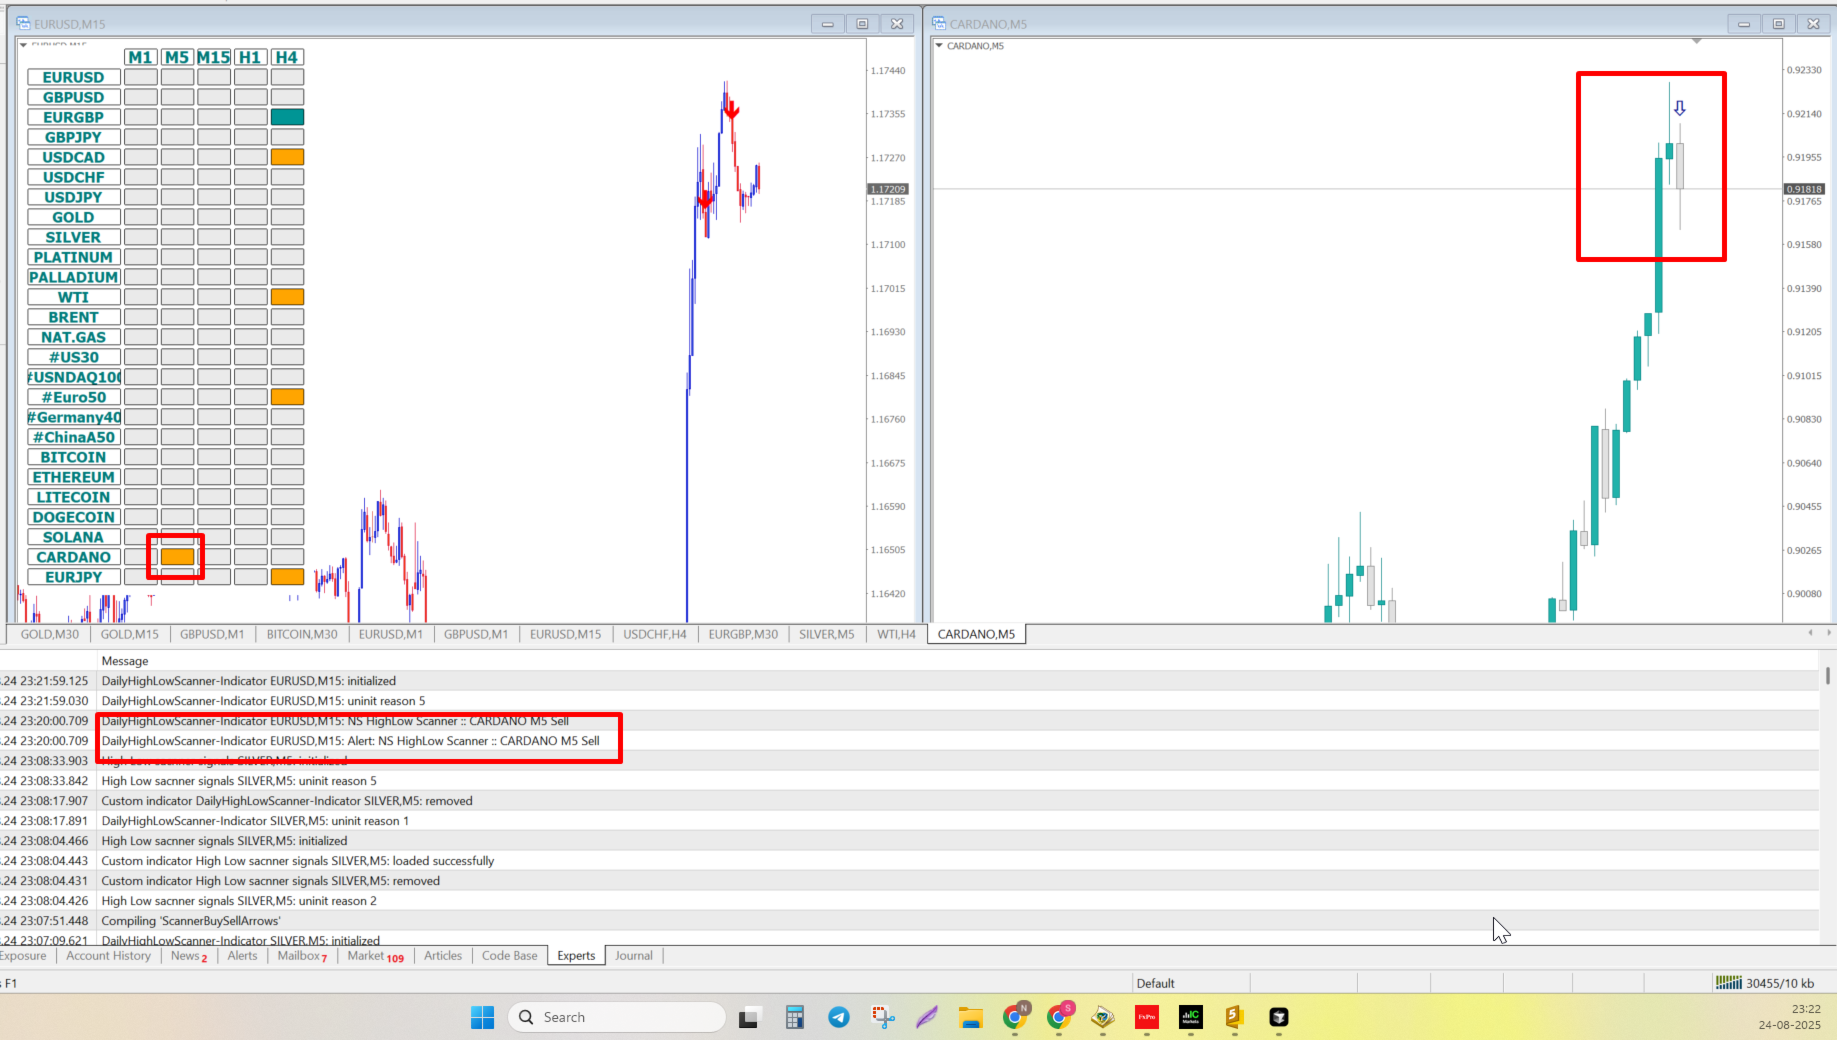
- Alert-based scanner - sends notifications when conditions are met
- Dashboard scanner - displays results in a visual panel
Common Scanner Features:
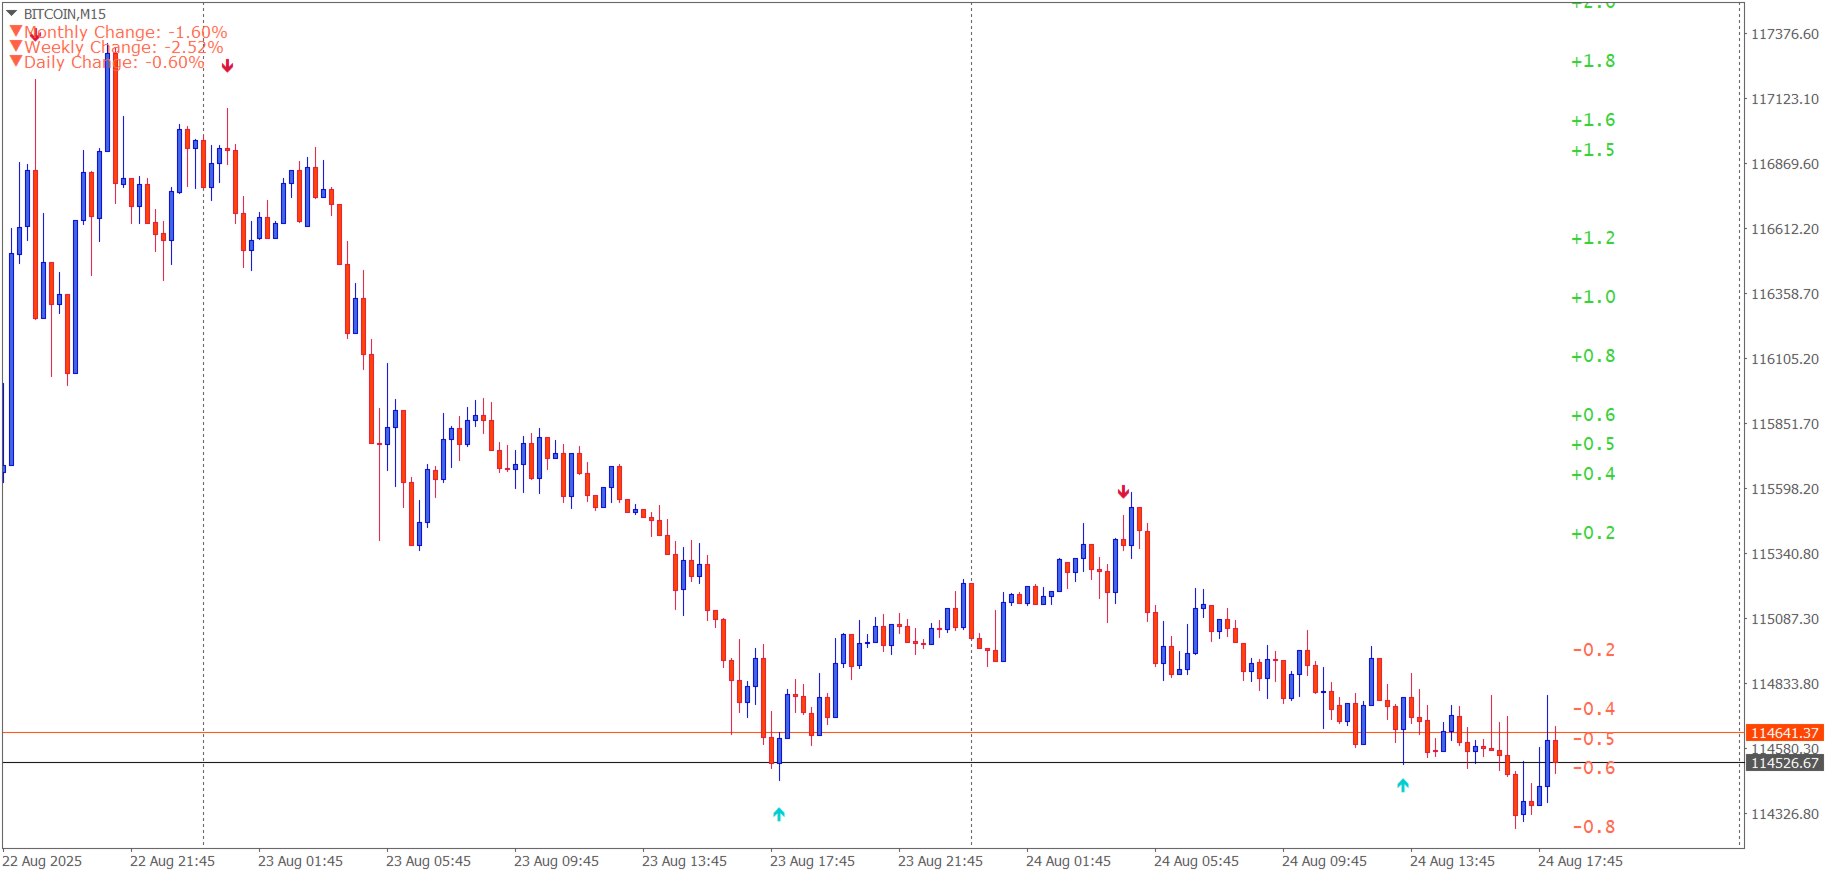
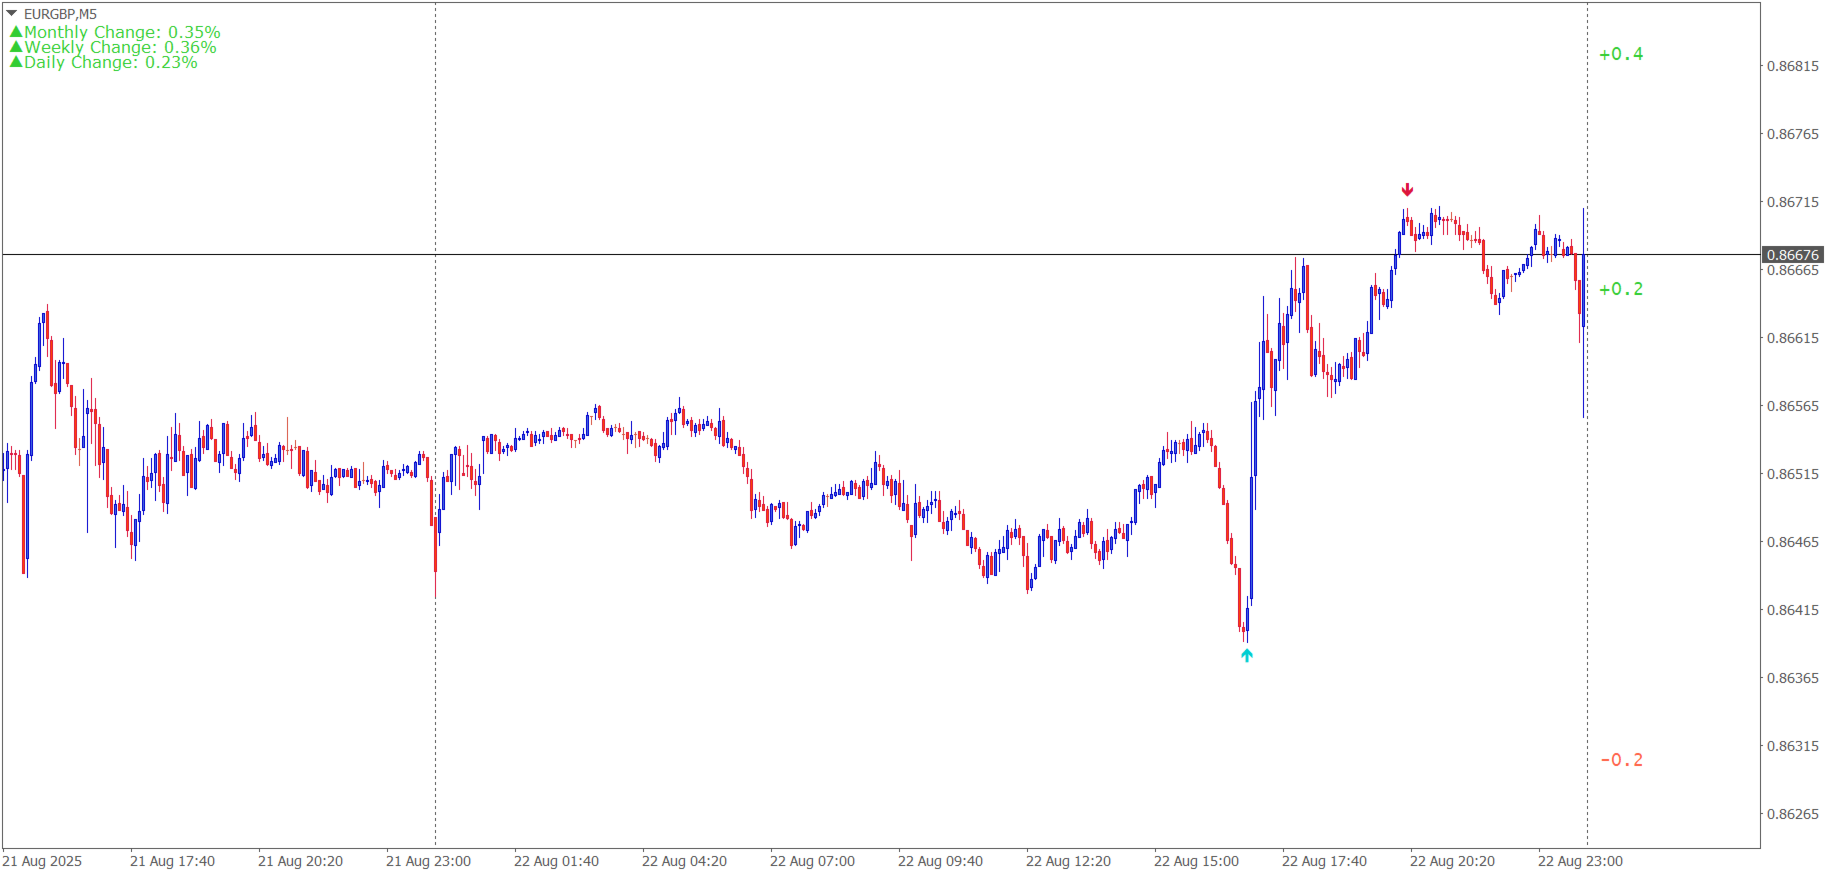
- Real-time monitoring of indicator values
- Customizable alert systems (popup, email, push notifications)
- Filter options for currency pairs and timeframes
Note :- Use any S/R levels or high low breakout concept to confirm day reversal its specially for intraday trading, Symbols max 30-50 for easy options remove extra symbols from your market watch.
Use our :-https://www.mql5.com/en/market/product/147960