How to Start with Metatrader 5 - page 100
You are missing trading opportunities:
- Free trading apps
- Over 8,000 signals for copying
- Economic news for exploring financial markets
Registration
Log in
You agree to website policy and terms of use
If you do not have an account, please register
Forum on trading, automated trading systems and testing trading strategies
How to Start with Metatrader 5
Sergey Golubev, 2017.02.12 06:36
MetaTrader 5 - More Than You Can Imagine!The development of MetaTrader 5 started in 2007. MetaTrader 5 was conceived as a revolutionary, multi-market platform that can run on Forex as well as on any other financial market. A lot of work has been done since then, and the result of this work is the platform that provides unlimited opportunities to traders. In this article, we will talk about all the key features of MetaTrader 5 and carry out a comparative analysis with the previous version of the trading platform.
------------------------
And this is the MT5 user manual:
MetaTrader 5 Help - Trading Platform — User Manual
Just some information related to Virtual Hosting (just to remind):
1. Why Virtual Hosting On The MetaTrader 4 And MetaTrader 5 Is Better Than Usual VPS
2. How to Prepare a Trading Account for Migration to Virtual Hosting
3. 64-bit Metatrader only to use Virtual Hosting:
Forum on trading, automated trading systems and testing trading strategies
Mt5 VPS
Slava, 2016.06.28 16:25
It must be 64-bit client terminal to use virtual hosting
Forum on trading, automated trading systems and testing trading strategies
MQL5.com VPS hosting
Slava, 2016.06.28 16:36
You can run multiple EAs on one virtual hosting server right now. Without additional pay.
Why do You want pay more money? There are no plans to multiply payments for virtual hosting
Beginner Journey: How to promote signals to gain subs?
Forum on trading, automated trading systems and testing trading strategies
How to Start with Metatrader 5
Sergey Golubev, 2017.01.09 06:38
Do you sell something on the Market? Are you signal provider? So, just some links about promotion:
Forum on trading, automated trading systems and testing trading strategies
Beginner Journey: How to promote signals to gain subs?
Sergey Golubev, 2017.05.08 18:40
Signals /Widgets
Signal widget displays the current information about one signal. Its content is updated automatically.
Forum on trading, automated trading systems and testing trading strategies
How to Start with Metatrader 5
Sergey Golubev, 2017.01.09 06:37
As the users are asking om PM about how to promote their signals and market products so I am just re-posting this information about.And just want to remind that the promotion of signals and market products is prohibited on the forum sorry.
-----------
One way to promote your signal is to create any external blog and place a widget there:
MetaTrader 4 and MetaTrader 5 Trading Signals Widgets
This is the my personal example with my google blog:
Forum on trading, automated trading systems and testing trading strategies
MQL5 Widget
Sergey Golubev, 2013.06.23 11:51
I installed widget (Top Signals) for my google blog in easy way using this link for example so everybody can do it (widget for some particular signal or signals, or widget for some broker). I did not place it on some other websites because I am not a signal provider and I am not market vendor. But I think that google blogs' promotion as a widget (together with simple promotion using facebook, twitter and google+) are fully enough to get some subscribers/clients.
But if some signal provider (or Market vendor) wants to get many subscribers/clients so it may be necessary to go to more quick way - go to the other Metatrader forums to promote your signal or product in direct way - just my experience.
And the other good and quick possibility is the following: open the signal page and click on share:
--------------------
And calendar widget: Add the new Economic Calendar widget to your website for free!
the article: Embed MetaTrader 4/5 WebTerminal on your website for free and make a profit
Correlation
Video
MT5 CodeBase
MT5 CodeBase on HowTo :
Forum on trading, automated trading systems and testing trading strategies
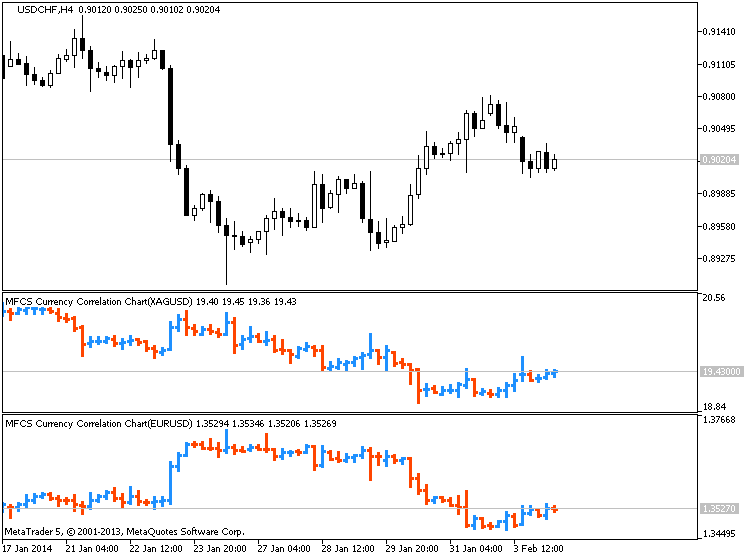
Indicators: MFCS Currency Correlation Chart
Sergey Golubev, 2013.10.26 09:29
Currency Pairs Correlation in Forex Market: Cross Currency Pairs
As a forex trader, if you check several different currency pairs to find the trade setups, you should be aware of the currency pairs correlation, because of two main reasons:
1- You avoid taking the same position with several correlated currency pairs at the same time and so you do not multiply your risk. Additionally, you avoid taking the positions with the currency pairs that move against each other, at the same time. 2- If you know the currency pairs correlations, it may help you to predict the direction and movement of a currency pair, through the signals that you see on the other correlated currency pairs.
Now I explain how currency pairs correlation helps. Lets start with the 4 major currency pairs: EURUSD ; GBPUSD ; USDJPY and USDCHF.
In both of the first two currency pairs (EURUSD and GBPUSD), USD works as the money. As you know, the first currency in currency pairs is known as the commodity and the second one is the money. So when you buy EURUSD, it means you pay USD to buy Euro. In EURUSD and GBPUSD, the currency that works as the money is the same (USD). The commodity of these pairs are both related to two big European economies. These two currencies are highly connected and related to each other and in 99% of the cases they move on the same direction and form the same buy/sell signals. Just recently, because of the economy crisis, they moved a little differently but their main bias is still the same.
What does it mean? It means if EURUSD shows a buy signal, GBPUSD should also show a buy signal with minor differences in the strength and shape of the signal. If you analyze the market and you come to this conclusion that you should go short with EURUSD and at the same time you decided to go long with GBPUSD, it means something is wrong with your analysis and one of your analysis is wrong. So you should not take any position until you see the same signal in both of these pairs. Of course, when these pairs really show two different direction (which rarely happens), it will be a signal to trade EUR-GBP. I will tell you how.
Accordingly, USD-CHF and USDJPY behave so similar but not as similar as EURUSD and GBPUSD, because in USD-CHF and USDJPY, money is different. Swiss Franc and Japanese Yen have some similarities because both of them belong to oil consumer countries but the volume of industrial trades in Japan, makes JPY different.
Generally, when you analyze the four major currency pairs, if you see buy signals in EURUSD and GBPUSD, you should see sell signals in USDJPY. If you also see a sell signal in USD-CHF, then your analysis is more reliable. Otherwise, you have to revise and redo your analysis.
EURUSD, GBPUSD, AUDUSD, NZDUSD, GBPJPY, EURJPY, AUDJPY and NZDJPY usually have the same direction. Just their movement pattern sometimes becomes more similar to each other and sometimes less.
What do I prefer?
If I find a sell signal with EURUSD and GBPUSD and a buy signal with USDJPY, I prefer to take the short position with one of the EURUSD or GBPUSD because downward movements are usually stronger. I will not take the short position with EURUSD or GBPUSD and the long position with USDJPY at the same time, because if any of these positions goes against me, the other one will do the same. So I don’t double my risk by taking two opposite positions with two currency pairs that move against each other.
How to use the currency pairs correlation to predict the direction of the market?
When I have a signal with a pair, but I need confirmation to take the position, I refer to the correlated currency pairs or cross currency pairs and look for the confirmation. For example I see a MACD Divergence in USDCAD four hours chart but there is no close support breakout in USDCAD four hours or one hour chart. I want to take a short position but I just need a confirmation. If I wait for the confirmation, it can become too late and I may miss the chance. I check a correlated currency pair like USDSGD and if I see a support breakout in it, I take the short position with USDCAD. Now the question is why I don’t take the short position with USDSGD and I use its support breakout to go short with USDCAD? I do it because USDCAD movements are stronger and more profitable. I use USDSGD just as an indicator to trade USCAD.
It happens that you take a position with a currency pair, but it doesn’t work properly and you don’t know if it was a good decision or not. On the other hand, you don’t see any sharp signal on that currency pair to help you decide if you want to keep the position or close it. In such cases, you can check a correlated currency pair and look for a continuation or reversal signal. It helps you to decide about the position you have.
Sometimes, some correlated currency pairs don’t move in the way that they are supposed to move. For example EURUSD and USDJPY go up at the same time, whereas they usually move against each other. It can happen when Euro value goes up and USD value doesn’t have a significant change, but at the same time JPY value goes down, because of some reason. In these cases, you can use the below table to find and trade the currency pair that its movement is intensified by an unusual movement in two other currency pairs. In this example, if EURUSD and USDJPY go up at the same time, EURJPY will go up much stronger (see the below chart).
Or if EURUSD goes up and AUDUSD goes down at the same time, EUR-AUD goes up strongly.
Another important example: If EURUSD goes up and GBPUSD goes down at the same time, EURGBP goes up strongly. Maybe this is the most important case that we can trade based on this rule. It happens many times that EURUSD and GBPUSD move against each other and that is the best time to trade EURGBP. Now you know why EURGBP doesn’t move strongly most of the time. It is because EURUSD and GBPUSD move in the same direction most of the time. For example they go up at the same time and so EURGBP doesn’t show any significant movement because when both of the currencies of a currency pair go up or down at the same time, that currency pair doesn’t show any strong movement and direction (I hope you know why a currency pair goes up or down. It goes up when the first currency value goes up OR the second currency value goes down. For example EURUSD goes up, if Euro value goes up or USD value goes down. If this happens at the same time, then EURUSD goes up much stronger).
The below chart includes almost all of these unusual movements and their results on the third currency pair.
if EURUSD and USDJPY then EURJPY means if EURUSD and USDJPY go up at the same time, then EURJPY goes up much stronger.
Forum on trading, automated trading systems and testing trading strategies
Indicators: MFCS Currency Correlation Chart
Sergey Golubev, 2014.02.04 08:27
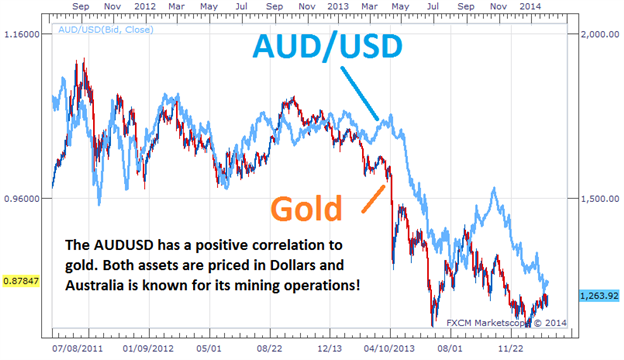
Trade Gold Using Currency Correlations (based on dailyfx article)
Talking Points:
- Correlations are useful to find direction for a variety of markets.
- Gold and the AUDUSD have a positive correlation.
- Once direction is found, plan your trading strategy for another asset.
Understanding correlations is a great way for traders to form opinions on markets that they may previously not follow. The idea of a correlation is to take two seemingly different markets or assets and see how market price moves relative to each other. Today we will review using the AUDUSD currency pair to determine the direction of gold through the use of a correlation.Let’s get started!
Golds Correlation
When someone mentions Gold, the AUDUSD should immediately come to mind as a correlating asset. These assets are positively correlated, meaning they can be seen generally moving in the same direction. First this correlation works because both assets are priced in US Dollars. The AUD/USD pair represents Aussie Dollars priced in US Dollars. While gold is XAU/USD or gold priced in US Dollars per oz. When the US dollar gains strength, both assets tend to depreciate in value.
Secondly, the AUD has a high correlation to gold due to Australia’s extensive gold mining operations. As gold prices fluctuate, this increases or decreases the amount of funds transferred into AUD to make purchases of the metal. These transfers essentially change demand for the currency and can directly cause changes in the AUDUSD currency pair as well.
Trading the Correlation
The key to trading positively correlated assets, is finding a direction from one of the underlying assets before making a trading decision. If traders are seeing the AUDUSD push to lower lows, this could easily be the catalyst for a bearish bias on Gold. Conversely if gold is trending upwards, this can also be a signal of a new uptrend on the AUDUSD.
As you can see, this information is very useful to traders that have a general fundamental view of the market. If you have an opinion on Gold or the US Dollar this can be relayed into a trade idea. Often traders that are bullish on Gold choose to trade the AUDUSD instead of the metal itself. The Aussie Dollar carries a 2.50% banking rate, meaning traders can earn additional interest while executing a buy order on a positively correlated opinion of Gold. If a trader is bearish on the AUDUSD currency pair, traders can in turn sell gold to avoid accumulating interest on their trading balance.
Forum on trading, automated trading systems and testing trading strategies
Indicators: MFCS Currency Correlation Chart
Sergey Golubev, 2014.02.04 09:27
Australian Dollar Strongly Correlated to Gold, Silver, Steel Prices (based on this article)
View forex correlations to the SPDR Gold ETF Trust (GLD), United States Oil Fund ETF (USO), SPDR Dow Jones Industrial Average ETF Trust (DIA), UK FTSE 100 Index, and IShares Silver Trust ETF (SLV) prices:
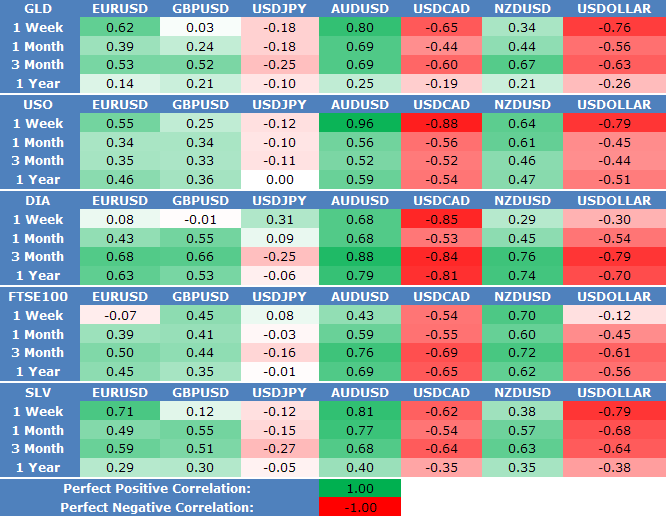
XAUUSD/AUDUSD :
XAGUSD/EURUSD :
XAGUSD/USDCAD :
Just some information about the Signal Service (good for newbies about how to start):
ElliottWaveMaker 3.0 - expert for MetaTrader 5 :
Forum on trading, automated trading systems and testing trading strategies
Expert Advisors: ElliottWaveMaker 3.0
Sergey Golubev, 2013.09.04 14:53
This is very simplified description about : Elliott Wave
======
Elliott Wave theory states that prices move in waves. These waves occur in a repeating pattern of a (1) move up, (2) then a partial retracement down, (3) another move up, (4) a retracement, (5) then finally a last move up. Then, there is a (A) full retracement, followed by a (B) partial retracement upward, then (C) a full move downward. This repeats on a macro and micro time frame. A visual illustration of the basic pattern of the Elliott Wave is given below. A real life example of Elliott Wave in action is given further down:
Elliott Wave is based on crowd psychology of booms and busts, rallies and retracements. Traders often use fibonacci numbers (see: Fibonacci) to anticipate where a retracement is likely to end and thus the place where they should place their trade. The chart below illustrates the Elliott Wave pattern applied to crowd psychology (i.e. S&P 500) and Fibonacci Retracements:
Trading the Elliott WaveIn the example above of the S&P 500 ETF, if the Elliott Wave theorist recognizes that he/she just completed a the leg from (2) to (3) and the market is beginning to retrace, the trader might put a buy order at the 38% Fibonacci retracement. In the example above, that trade would have failed and the trader would have been stopped out of their long position. The trader then might consider putting an order in at the 50% retracement. In the example above, that would have been an extremely profitable trade, making up for the previous loss and more.
Next, realizing that the latest trend was the (4) to (5) upmove, the Elliot Wave theorist would next expect a downward move to (A). This retracement is larger than the previous (1) to (2) retracement and (3) to (4) retracement. A reasonable guess as to where the retracement (5) to (A) will end is the 0.618, the golden fibonacci ratio.
Selecting the 61% retracement would have proved profitable for a little while, assuming the trader didn't have extremely tight stop losses in place, but the retracement turned out to be a head fake. Subsequently, the next often used Fibonacci retracement is 100%. This trade would have been very profitable, given the S&P 500 retraced almost perfectly at 100% of the move from (4) to (5).
A likely profit target to exit at least part of the trade initiated at point (A) is the 38% Fibonacci level. This also happened to be the turning point for the next leg down from (B) to (C).
Forum on trading, automated trading systems and testing trading strategies
Expert Advisors: ElliottWaveMaker 3.0
Sergey Golubev, 2013.12.15 14:24
Elliott Wave (based on thetechnicaltraders article)
Every investor has seen the odd phenomena of stocks going down when there is good news about the stock or conversely stocks going up when there is bad news about the stock. Is there a system that can be used to help analyze these trends and to be able to then predict stock trends? The answer is yes, and one possibility is Elliot Wave Theory.
Elliot Wave Theory examines how groups of individuals react en masses to things in their environment and the psychological reasons for such reactions. Elliot Wave Theory then groups those reactions into predictable patterns or ‘waves. Once you have identified a particular trigger, you can then predict the coming waves and how groups will behave in accordance to those waves.
Elliot Waves: mini waves make up bigger waves
The key component of Elliot Wave Theory are the Elliot Waves themselves. Several mini Elliot Waves will make up one bigger wave. The bigger wave is known as a fractal. Fractals can then be grouped together to create an even larger wave showing a complete trend based one trigger.
Elliot Wave Predictions
The stock market is an excellent vehicle to use Elliot Wave Theory to analyze potential market trends. Once a potential trigger has been identified, the potential movement of the stock can be predicted by the applying the Elliot Wave principles. Opportunities for solid Elliot Wave Predictions exist whether the stock is moving in an upwards or downwards trend as Elliot Wave Theory accounts for upwards and downwards movement.
Elliot Wave Gold
Elliot Wave Theory can be applied to anything that is traded, including gold. Elliot Wave Gold systems can provide an opportunity for excellent growth. The key of course is being able to identify a trigger, understand that triggers implications, and then predict how groups of investors will react. That’s where solid, proven Elliot Wave Theory application can give you an edge in your invested strategies.
Just some improvements were announced yesterday here:
And this is the whole story: Improvements in chats: choose who can message you
MetaTrader 5 : Hedging option and testing on real ticks
Terminal: In addition to hedging support, the new platform version provides wider opportunities for migrating accounts from MetaTrader 4. Now, brokers can automatically transfer accounts to MetaTrader 5, including all operations: open and pending orders, and complete trading history.
Just more explanation related to MT4 backtresting vs MT5 backtesting (it was some question on the tyhread about it):
Forum on trading, automated trading systems and testing trading strategies
PriceChannel Parabolic system
Sergey Golubev, 2017.02.15 06:02
You can read this article (TESTING TRADING STRATEGIES ON REAL TICKS).
-------------------
Just an example -
MT4 and very old builds of MT5: I optimized the EAs from this thread just to find good settings for the pair, I was backtesting them, and I traded on demo for some time just to be sure that EAs are profitable.
With new builds of MT5: I will optimize the EAs from this thread to find the settings, and I will backtesting them with 'every tick based on real ticks' - and it will be same as trading by those EA on real account for many months or years!
Just more explanation related to MT4 backtresting vs MT5 backtesting (it was some question on the tyhread about it):