Correlation of Currencies
Forum on trading, automated trading systems and testing trading strategies
newdigital, 2014.02.26 13:23
Multi currency EA may be based on some other systems. The only thing to do (except the system itself) is 'account protection feature'. Because those kind of EAs may be risky, and this risk is for whole the account (just my opinion sorry). But it also depends on how it will be coded for example.
============
As to correlation so I found the following
Video
MT5 CodeBase
MT5 CodeBase on HowTo :
Forum on trading, automated trading systems and testing trading strategies
Indicators: MFCS Currency Correlation Chart
newdigital, 2013.10.26 09:29
Currency Pairs Correlation in Forex Market: Cross Currency Pairs
As a forex trader, if you check several different currency pairs to find the trade setups, you should be aware of the currency pairs correlation, because of two main reasons:
1- You avoid taking the same position with several correlated currency pairs at the same time and so you do not multiply your risk. Additionally, you avoid taking the positions with the currency pairs that move against each other, at the same time. 2- If you know the currency pairs correlations, it may help you to predict the direction and movement of a currency pair, through the signals that you see on the other correlated currency pairs.
Now I explain how currency pairs correlation helps. Lets start with the 4 major currency pairs: EURUSD ; GBPUSD ; USDJPY and USDCHF.
In both of the first two currency pairs (EURUSD and GBPUSD), USD works as the money. As you know, the first currency in currency pairs is known as the commodity and the second one is the money. So when you buy EURUSD, it means you pay USD to buy Euro. In EURUSD and GBPUSD, the currency that works as the money is the same (USD). The commodity of these pairs are both related to two big European economies. These two currencies are highly connected and related to each other and in 99% of the cases they move on the same direction and form the same buy/sell signals. Just recently, because of the economy crisis, they moved a little differently but their main bias is still the same.
What does it mean? It means if EURUSD shows a buy signal, GBPUSD should also show a buy signal with minor differences in the strength and shape of the signal. If you analyze the market and you come to this conclusion that you should go short with EURUSD and at the same time you decided to go long with GBPUSD, it means something is wrong with your analysis and one of your analysis is wrong. So you should not take any position until you see the same signal in both of these pairs. Of course, when these pairs really show two different direction (which rarely happens), it will be a signal to trade EUR-GBP. I will tell you how.
Accordingly, USD-CHF and USDJPY behave so similar but not as similar as EURUSD and GBPUSD, because in USD-CHF and USDJPY, money is different. Swiss Franc and Japanese Yen have some similarities because both of them belong to oil consumer countries but the volume of industrial trades in Japan, makes JPY different.
Generally, when you analyze the four major currency pairs, if you see buy signals in EURUSD and GBPUSD, you should see sell signals in USDJPY. If you also see a sell signal in USD-CHF, then your analysis is more reliable. Otherwise, you have to revise and redo your analysis.
EURUSD, GBPUSD, AUDUSD, NZDUSD, GBPJPY, EURJPY, AUDJPY and NZDJPY usually have the same direction. Just their movement pattern sometimes becomes more similar to each other and sometimes less.
What do I prefer?
If I find a sell signal with EURUSD and GBPUSD and a buy signal with USDJPY, I prefer to take the short position with one of the EURUSD or GBPUSD because downward movements are usually stronger. I will not take the short position with EURUSD or GBPUSD and the long position with USDJPY at the same time, because if any of these positions goes against me, the other one will do the same. So I don’t double my risk by taking two opposite positions with two currency pairs that move against each other.
How to use the currency pairs correlation to predict the direction of the market?
When I have a signal with a pair, but I need confirmation to take the position, I refer to the correlated currency pairs or cross currency pairs and look for the confirmation. For example I see a MACD Divergence in USDCAD four hours chart but there is no close support breakout in USDCAD four hours or one hour chart. I want to take a short position but I just need a confirmation. If I wait for the confirmation, it can become too late and I may miss the chance. I check a correlated currency pair like USDSGD and if I see a support breakout in it, I take the short position with USDCAD. Now the question is why I don’t take the short position with USDSGD and I use its support breakout to go short with USDCAD? I do it because USDCAD movements are stronger and more profitable. I use USDSGD just as an indicator to trade USCAD.
It happens that you take a position with a currency pair, but it doesn’t work properly and you don’t know if it was a good decision or not. On the other hand, you don’t see any sharp signal on that currency pair to help you decide if you want to keep the position or close it. In such cases, you can check a correlated currency pair and look for a continuation or reversal signal. It helps you to decide about the position you have.
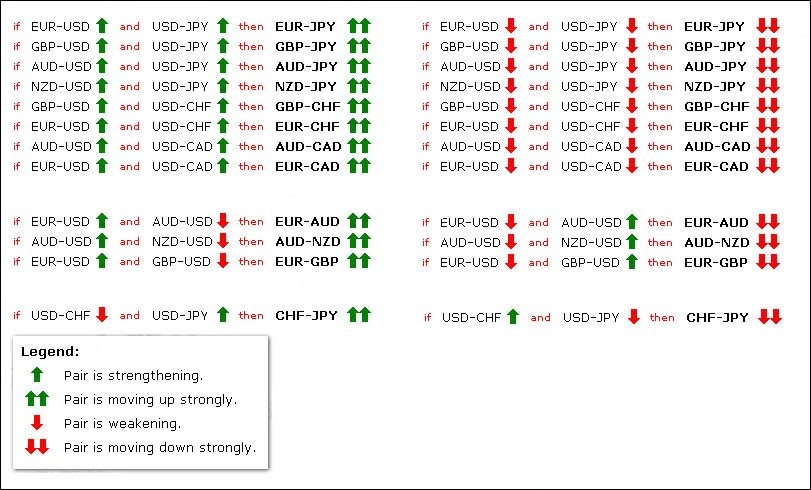
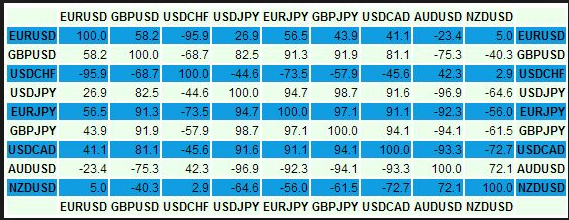
Sometimes, some correlated currency pairs don’t move in the way that they are supposed to move. For example EURUSD and USDJPY go up at the same time, whereas they usually move against each other. It can happen when Euro value goes up and USD value doesn’t have a significant change, but at the same time JPY value goes down, because of some reason. In these cases, you can use the below table to find and trade the currency pair that its movement is intensified by an unusual movement in two other currency pairs. In this example, if EURUSD and USDJPY go up at the same time, EURJPY will go up much stronger (see the below chart).
Or if EURUSD goes up and AUDUSD goes down at the same time, EUR-AUD goes up strongly.
Another important example: If EURUSD goes up and GBPUSD goes down at the same time, EURGBP goes up strongly. Maybe this is the most important case that we can trade based on this rule. It happens many times that EURUSD and GBPUSD move against each other and that is the best time to trade EURGBP. Now you know why EURGBP doesn’t move strongly most of the time. It is because EURUSD and GBPUSD move in the same direction most of the time. For example they go up at the same time and so EURGBP doesn’t show any significant movement because when both of the currencies of a currency pair go up or down at the same time, that currency pair doesn’t show any strong movement and direction (I hope you know why a currency pair goes up or down. It goes up when the first currency value goes up OR the second currency value goes down. For example EURUSD goes up, if Euro value goes up or USD value goes down. If this happens at the same time, then EURUSD goes up much stronger).
The below chart includes almost all of these unusual movements and their results on the third currency pair.
if EURUSD and USDJPY then EURJPY means if EURUSD and USDJPY go up at the same time, then EURJPY goes up much stronger.
Forum on trading, automated trading systems and testing trading strategies
Indicators: MFCS Currency Correlation Chart
newdigital, 2014.02.04 08:27
Trade Gold Using Currency Correlations (based on dailyfx article)
Talking Points:
- Correlations are useful to find direction for a variety of markets.
- Gold and the AUDUSD have a positive correlation.
- Once direction is found, plan your trading strategy for another asset.
Let’s get started!
Golds Correlation
When someone mentions Gold, the AUDUSD should immediately come to mind as a correlating asset. These assets are positively correlated, meaning they can be seen generally moving in the same direction. First this correlation works because both assets are priced in US Dollars. The AUD/USD pair represents Aussie Dollars priced in US Dollars. While gold is XAU/USD or gold priced in US Dollars per oz. When the US dollar gains strength, both assets tend to depreciate in value.
Secondly, the AUD has a high correlation to gold due to Australia’s
extensive gold mining operations. As gold prices fluctuate, this
increases or decreases the amount of funds transferred into AUD to make
purchases of the metal. These transfers essentially change demand for
the currency and can directly cause changes in the AUDUSD currency pair
as well.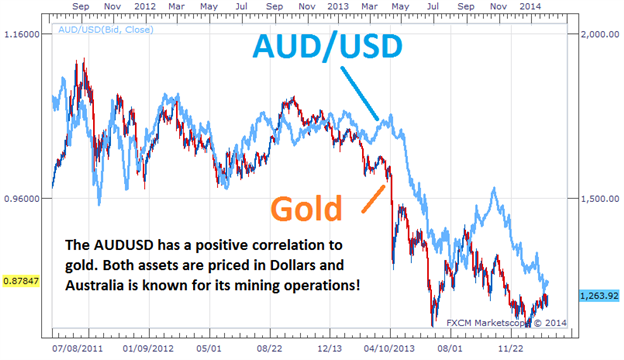
Trading the Correlation
The key to trading positively correlated assets, is finding a direction from one of the underlying assets before making a trading decision. If traders are seeing the AUDUSD push to lower lows, this could easily be the catalyst for a bearish bias on Gold. Conversely if gold is trending upwards, this can also be a signal of a new uptrend on the AUDUSD.

As you can see, this information is very useful to traders that have a
general fundamental view of the market. If you have an opinion on Gold
or the US Dollar this can be relayed into a trade idea. Often traders
that are bullish on Gold choose to trade the AUDUSD instead of the metal
itself. The Aussie Dollar carries a 2.50% banking rate, meaning traders
can earn additional interest while executing a buy order on a
positively correlated opinion of Gold. If a trader is bearish on the
AUDUSD currency pair, traders can in turn sell gold to avoid
accumulating interest on their trading balance.
Forum on trading, automated trading systems and testing trading strategies
Indicators: MFCS Currency Correlation Chart
newdigital, 2014.02.04 09:27
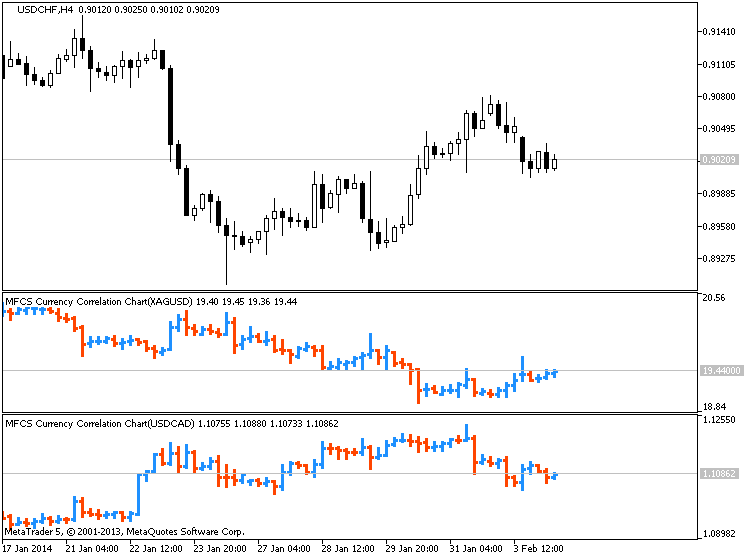
Australian Dollar Strongly Correlated to Gold, Silver, Steel Prices (based on this article)
View forex correlations to the SPDR Gold ETF Trust
(GLD), United States Oil Fund ETF (USO), SPDR Dow Jones Industrial
Average ETF Trust (DIA), UK FTSE 100 Index, and IShares Silver Trust ETF
(SLV) prices: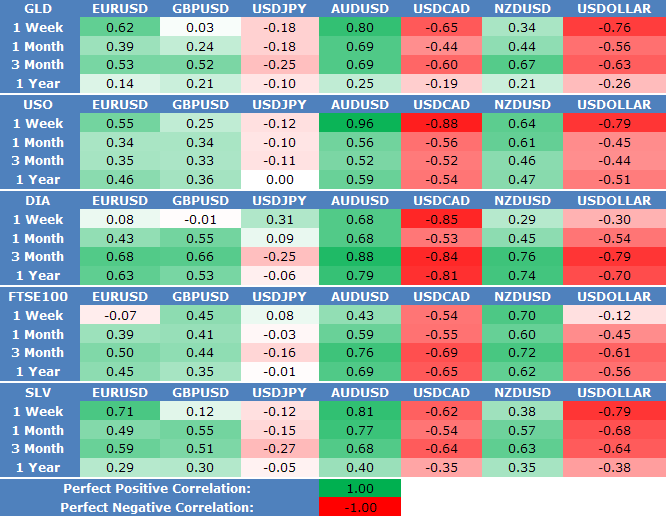
XAUUSD/AUDUSD :
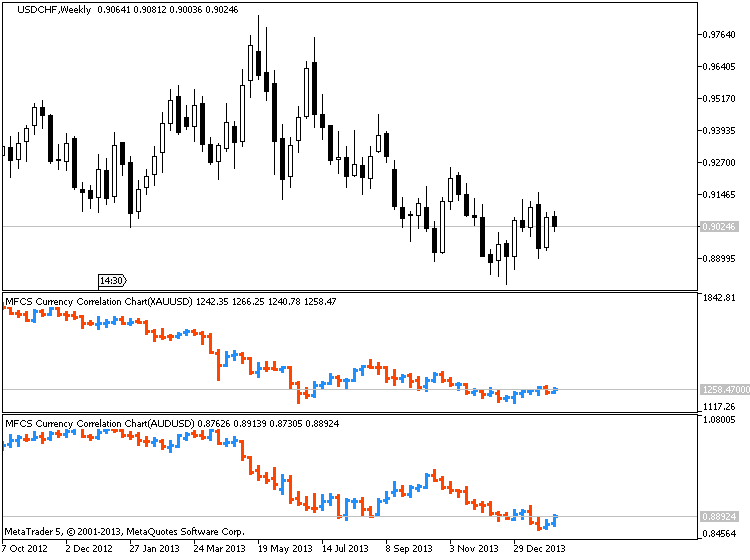
XAGUSD/EURUSD :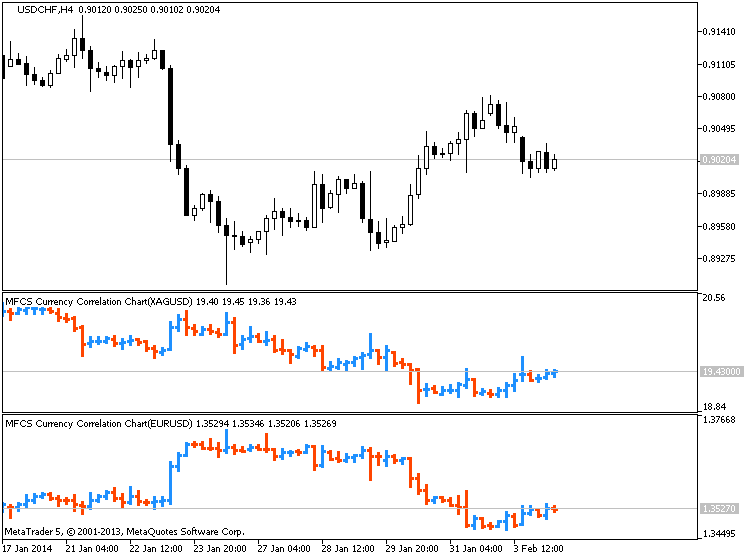
XAGUSD/USDCAD :
Some currency pairs tend to move together in the same direction. Other currency pairs tend to move in opposite directions. Understanding how currency pairs tend to move relative to one another can be used in a number of different ways. It can be used to analyze how diversified your Forex portfolio is and, indirectly, your risk profile. It can also be used to understand how to enter into hedging trades.
Currency correlations measure how closely currency pair prices have (statistically) moved together in the past. Example of how some currencies are correlated with each other. Positively or Negatively
0.0 to 0.2 Very weak to negligible correlation
0.2 to 0.4 Weak, low correlation (not significant)
0.4 to 0.7 Moderate correlation
0.7 to 0.9 Strong, high correlation
0.9 to 1.0 Very strong correlation
Forum on trading, automated trading systems and testing trading strategies
Sergey Golubev, 2016.10.17 10:55
Multi Instrument Indicator for MetaTrader 4
This is very interesting indicator: we can add the price of one or several other instruments to one window.
This is USDCHF price on the EURUSD chart:
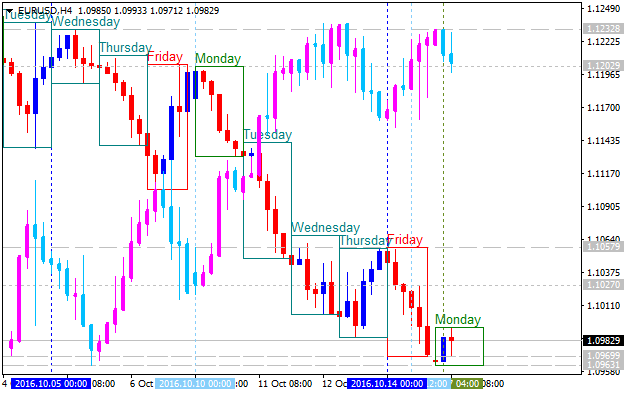
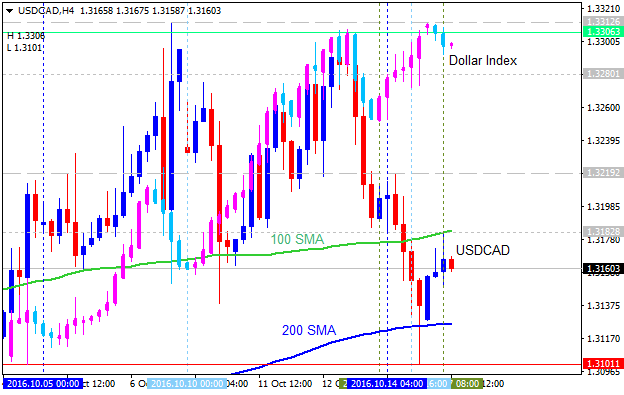
This is Dollar Index price on USDCAD price:
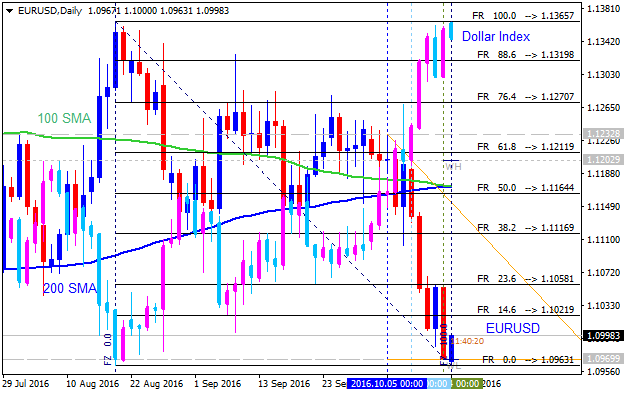
This is Dollar Index on EURUSD chart:
Attention however, mistake to commit not: although some pairs are moving in a correlative direction, it's not moving at the same pace.
Example : EURUSD up + USDJPY up ----> EURJPY up
EURUSD uptrending 100 pts + USDJPY uptrending 100 pts doesn't mean EURJPY will move 100 pts, nor 200 pts.
The perfect synchronization between pairs is theoric only, what by the way make triangular arbitrage impossible.
Formulating Dynamic Multi-Pair EA (Part 1): Currency Correlation and Inverse Correlation
: Currency Correlation and Inverse Correlation")
We will formulate dynamic multi pair EA to handle multiple currency pairs simultaneously. The system will provide flexibility by enabling you to input, change and modify currency pairs according to your trading strategy. A key feature of this system is its ability to define a primary or "main" currency pair, which acts as a signal provider for other currency pairs.
The system also supports dynamic adjustments based on the strength of correlations between currency pairs. For example, if a strong bullish signal is detected in the main currency pair, the EA can automatically open corresponding trades in pairs that historically move in the same direction. Conversely, for pairs that typically move inversely to the main pair, the EA can open opposite positions, effectively hedging against potential market fluctuations.: Currency Correlation and Inverse Correlation")
- www.mql5.com
- Free trading apps
- Over 8,000 signals for copying
- Economic news for exploring financial markets
You agree to website policy and terms of use
I feel it would be worthwhile to give out a little, but, important information on currency correlation. Possessing the knowledge of how currencies are correlated could prove to be very important to your trading arsenal. It's just a matter of simple logic, but a very simply one that most traders fail to notice, especially newbies. It's very important so as to avoid taking double risks.
Okay, let's consider the pairing of EUR and USD (EURUSD). We are well aware of the fact that the first currency is always referred to as the base currency while the second is the quote. In other words, the base currency is the commodity, and the quote currency is the money. So, when you buy EURUSD, you pay USD to buy EUR.
The EURUSD and the GBPUSD are correlated in a similar way, i.e., they mostly always follow the same trending pattern (trade in the same direction) because the commodities (EUR and GBP) are currencies of two European economies, and they are closely related. When EURUSD and GBPUSD eventually, happen to trade in opposite direction, the best currency to trade at that moment would be the EURGBP, because, one of the two European currencies is much more stronger than the other. You'll understand better, later on.
Now, let's switch focus to two other currency pairing - USDCHF and USDJPY. These two are similar but not as similar as EURUSD and GBPUSD, because the quotes(money) are different. CHF and JPY belong to oil consumer countries and as such, have a similar behavior, the only difference being the volume of industrial trades in Japan. The USDCHF and USDJPY characteristically trade in the same direction, but in the opposite direction to the EURUSD and GBPUSD. Therefore, if your analysis favors long trade with USDCHF and USDJPY, then your analysis of EURUSD and GBPUSD should spot a short trade, otherwise you'll have to re-evaluate your analysis.
How useful is it? Very useful, I would say. By understanding how several currency pairs are correlated, you can spot a signal with one and use others as confirmation. For instance, if I find a bear signal with EURUSD and GBPUSD, and a bull signal with USDJPY, I would preferably go short with one of the EURUSD and GBPUSD because downward movements are usually stronger. Taking both short and long positions at the same time entails doubling your risk because if one of the positions goes against you the other shall do absolutely the same.
You may observe that sometimes, some correlated pairs don't move the way it's expected. For instance, GBPUSD and USDJY go bullish simultaneously instead of moving against each other as usual. This may happen as a result of the GBP gaining value while the USD counterpart's value does not have a significant change, and at the same time the JPY value drops, maybe, due to some bizarre reason. When this type of scenario is encountered, it would be rewarding to go long with the GBPJPY because its bullish momentum would be much stronger.
Still couldn't get it? Okay, let's do the maths.
GBPUSD is bullish => GBP gained value on USD
USDJPY is bullish => USD stronger than JPY
GPB > USD > JPY
From the above illustration, the GBP comes out the strongest while the JPY is the weakest. Trading the GBPJPY pair would yield a better reward. on the reverse, when both the GBPUSD and USDJPY are trending downwards. GBPJPY downtrend would be more stronger.
Same logic can be applied to several other currencies. Let's have another example; We understand that EURUSD and GBPUSD have identical correlation in the sense that they often follow the same trend. But in a situation whereby EURUSD trends downwards and GBPUSD trends upwards, EURGBP downward movement would be stronger because GBP becomes the strongest of all the currencies involve while EURUSD, the weakest.
EURUSD go bearish => EUR < USD
GBPUSD go bullish => GBP > USD
Outcome: GBP > USD > EUR
GBP is the strongest
EUR is the weakest
Therefore EURGBP => Strong downtrend.
It would be a wise decision to avoid either of the EURUSD and GBPUSD and trade EURGBP as the pair movement is more stable.
Well, that's it. Study the pair correlations, and you'll be glad you had the knowledge. I hope it helps. Wishing you all profitable trading.