Forecast and levels for S&P 500
Forum on trading, automated trading systems and testing trading strategies
Sergey Golubev, 2017.01.03 17:43
Intra-Day Fundamentals - EUR/USD, GBP/USD and S&P 500: ISM Manufacturing PMI
2017-01-03 15:00 GMT | [USD - ISM Manufacturing PMI]
- past data is 53.2
- forecast data is 53.7
- actual data is 54.7 according to the latest press release
if actual > forecast (or previous one) = good for currency (for USD in our case)
[USD - ISM Manufacturing PMI] = Level of a diffusion index based on surveyed purchasing managers in the manufacturing industry.
==========
From official report:
"The December PMI® registered 54.7 percent, an increase of 1.5 percentage points from the November reading of 53.2 percent. The New Orders Index registered 60.2 percent, an increase of 7.2 percentage points from the November reading of 53 percent. The Production Index registered 60.3 percent, 4.3 percentage points higher than the November reading of 56 percent. The Employment Index registered 53.1 percent, an increase of 0.8 percentage point from the November reading of 52.3 percent. Inventories of raw materials registered 47 percent, a decrease of 2 percentage points from the November reading of 49 percent. The Prices Index registered 65.5 percent in December, an increase of 11 percentage points from the November reading of 54.5 percent, indicating higher raw materials prices for the 10th consecutive month. The PMI®, New Orders, Production and Employment Indexes all registered new highs for the year 2016, and the forward-looking comments from the panel are largely positive."
==========
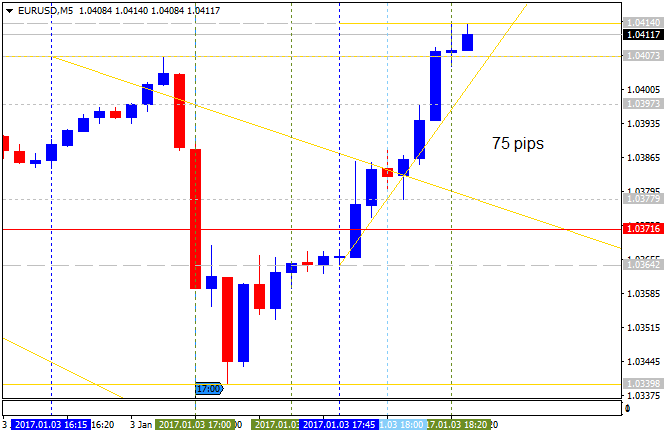
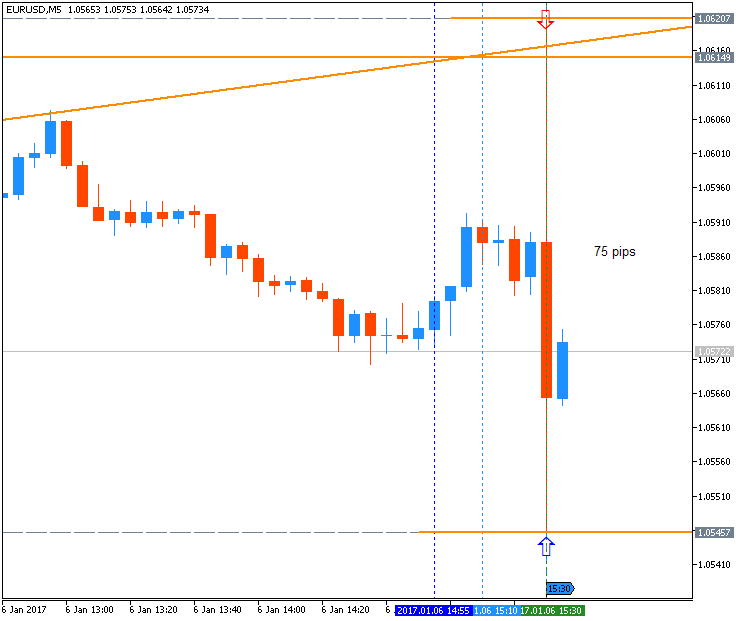
EUR/USD M5: 75 pips range price movement by ISM Manufacturing PMI news events
==========
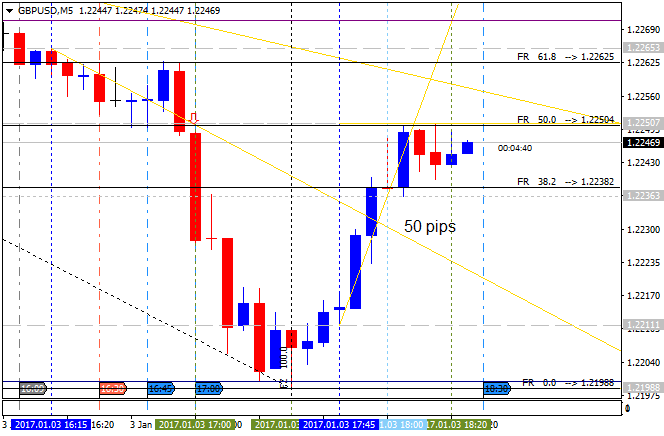
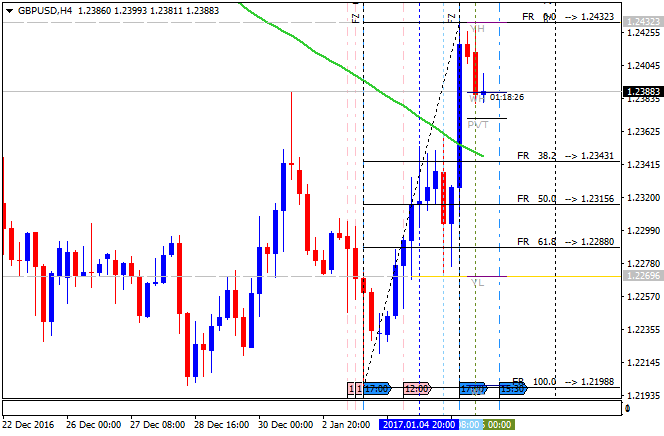
GBP/USD M5: 50 pips range price movement by ISM Manufacturing PMI news events
==========
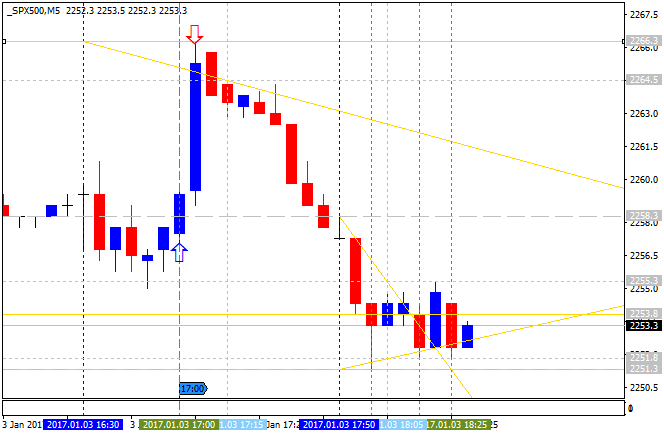
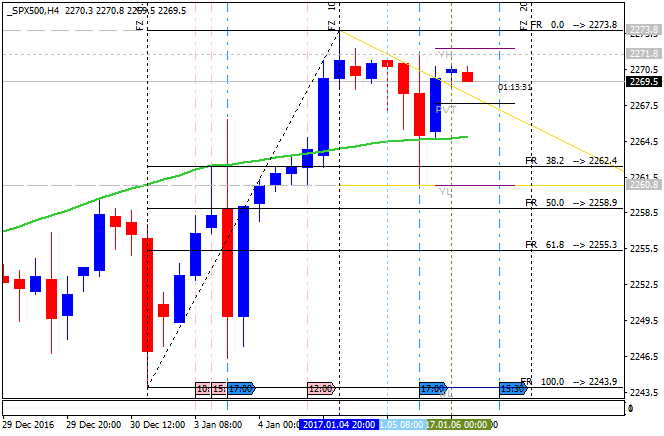
S&P 500: range pips price movement by ISM Manufacturing PMI news events
Forum on trading, automated trading systems and testing trading strategies
Sergey Golubev, 2017.01.06 05:39
Intra-Day Fundamentals - EUR/USD, GBP/USD and S&P 500: Non-Farm Employment Change
2017-01-06 13:30 GMT | [USD - Non-Farm Employment Change]
- past data is 178K
- forecast data is 175K
- actual data is n/a according to the latest press release
if actual > forecast (or previous one) = good for currency (for USD in our case)
[USD - Non-Farm Employment Change] = Change in the number of employed people during the previous month, excluding the farming industry.
==========
From the article: What To Expect From NFP? - Views From 10 Major Banks
BofA Merrill: "We look for a trend-like 175,000 gain in nonfarm payrolls. We expect 170,000 of this gain to come from the private sector and only 5,000 to come from the government sector. We think there is scope for the labor force participation rate to inch back up to 62.8% from 62.7%, and as a result, for the unemployment rate to move back up towards 4.8%. Smoothing through the volatility of wage growth in the past couple of months, we look for average hourly earnings to gain a trend-like 0.2% mom after a 0.1% mom contraction in November. This would push the year-over-year rate up to a healthier 2.7% from 2.5%."
==========
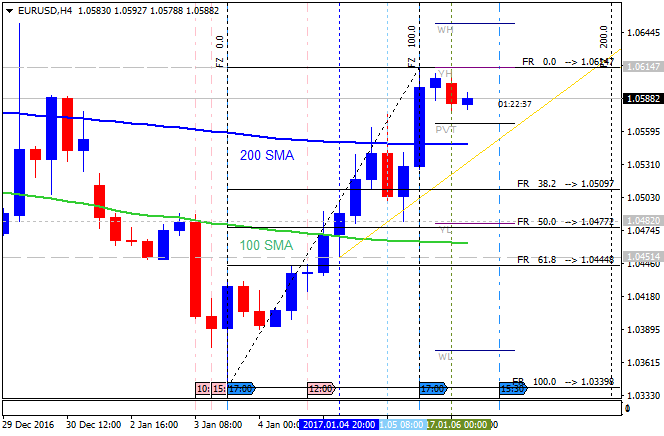
EUR/USD H4 ahead of NFP: bullish reversal with 1.0614 resistance to be broken for the bullish trend to be continuing
==========
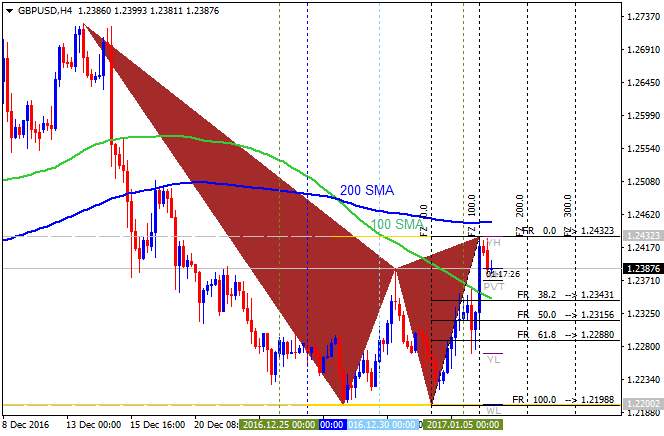
GBP/USD H4 ahead of NFP: ranging within 200/100 SMA area waiting for direction
==========
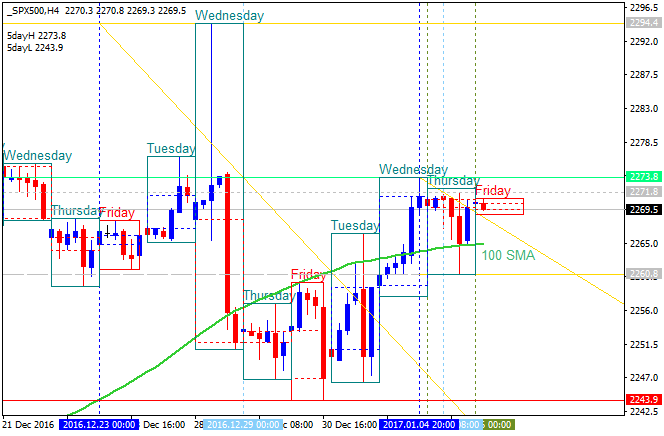
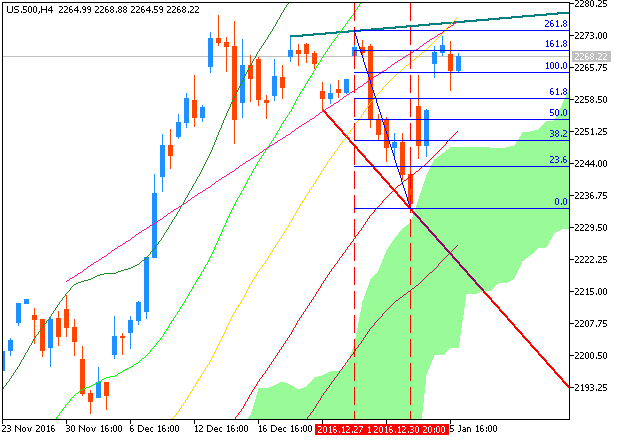
S&P 500 H4 ahead of NFP: trending above 200 SMA and near above 100 SMA for the bullish trend to be continuing or for the ranging condition to be started
Forum on trading, automated trading systems and testing trading strategies
Sergey Golubev, 2017.01.06 11:11
Nasdaq Hits New High as Dow, S&P 500 Slip (based on the article)
"The S&P 500 dipped 0.1% to 2,269.00 today, while the Dow Jones Industrial Average declined 42.87 points, or 0.2%, to 19,899.29. The Nasdaq Composite rose 0.2% to 5,487.94, a new record."
Dow Jones Industrial Average: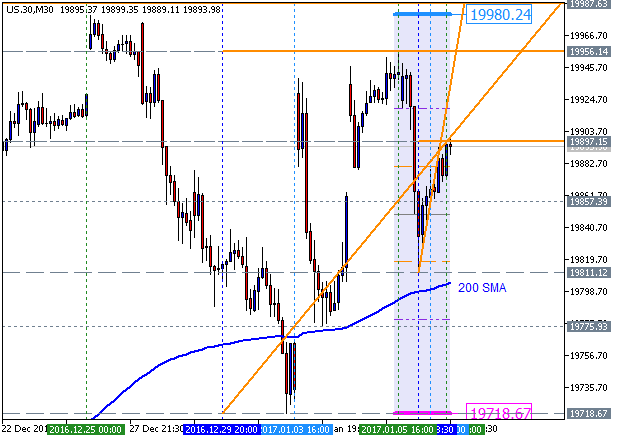
S&P 500:
"The S&P 500 reached new all-time highs in December and then moved horizontally on lighter volume as the holiday period approached. The S&P 500 reached overbought status on some oscillators in early December and both its internal momentum and the number of NYSE stocks making new 52-week highs pulled back markedly towards year-end. Equity put/call ratios (a contrary indicator) and bullish prognosticator show rising optimism and the percentage of NYSE stocks trading above their respective 50-day Moving Averages were at 67% at year-end (courtesy of Investors Intelligence). With the S&P 500 near its all-time highs, these negative divergences suggest a correction."
Forum on trading, automated trading systems and testing trading strategies
Sergey Golubev, 2017.01.06 14:37
Intra-Day Fundamentals - EUR/USD, GBP/USD and S&P 500: Non-Farm Employment Change
2017-01-06 13:30 GMT | [USD - Non-Farm Employment Change]
- past data is 178K
- forecast data is 175K
- actual data is 156K according to the latest press release
if actual > forecast (or previous one) = good for currency (for USD in our case)
[USD - Non-Farm Employment Change] = Change in the number of employed people during the previous month, excluding the farming industry.
==========
From the official report:
"Total nonfarm payroll employment rose by 156,000 in December, and the unemployment rate was little changed at 4.7 percent, the U.S. Bureau of Labor Statistics reported today. Job growth occurred in health care and social assistance."
==========
EUR/USD M5: 75 pips range price movement by Non-Farm Payrolls news events
==========
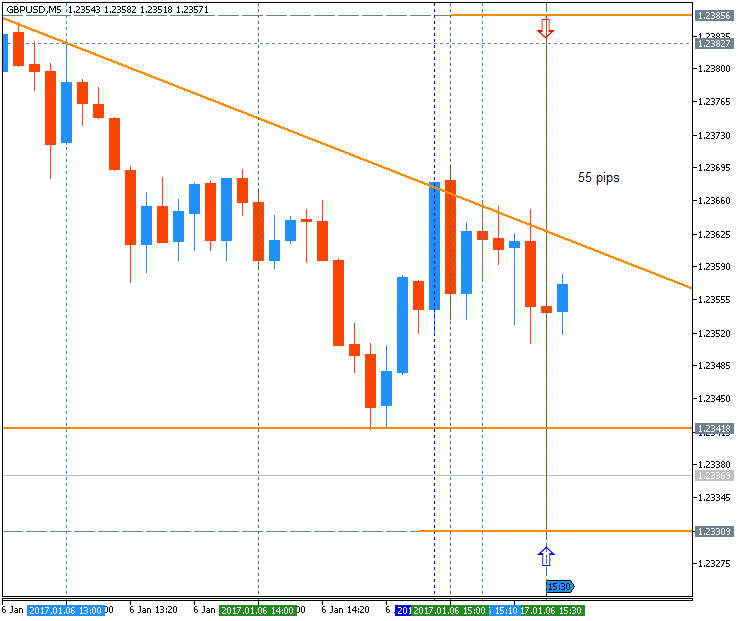
GBP/USD M5: 37 pips range price movement by Non-Farm Payrolls news events
==========
S&P 500: pips range price movement by Non-Farm Payrolls news events

Forum on trading, automated trading systems and testing trading strategies
Sergey Golubev, 2017.01.13 14:32
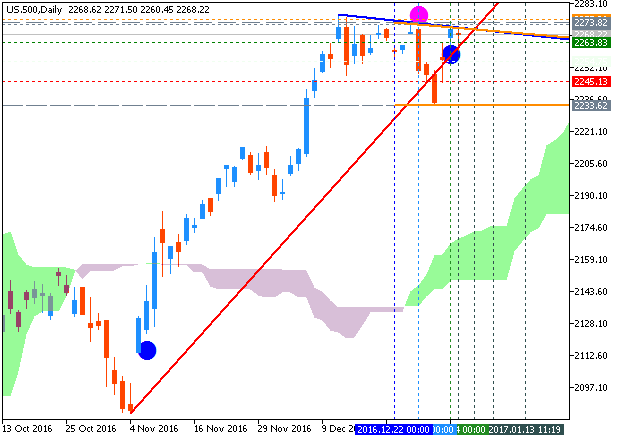
S&P 500 Technical Analysis: daily ranging for direction (based on the article)
Daily price is continuing with the ranging condition within the primary bullish trend: the price is located above Ichimoku cloud in the bullish area of the chart for the ranging within 2,282 resistance level for the bullish trend to be continuing and 2,233 support level for the secondary correction to be started./
- "The S&P 500 continues to chop sideways, building what appears, as we’ve been discussing recently, a base for an eventual breakout to new highs. Yesterday, the market started out on a negative note, dropping through the trend-line rising up off the November low, but by day’s end the decline was met with buying and closed back above. The rejection and recovery is a good sign for the market. The day low also happened to come around a top-side trend-line extending over peaks in 2007 and 2015, but hasn’t been discussed much due to how long-term it is. However, with the market now abiding by it on two occasions – once in the middle of December and then yesterday – it’s in play."
- "The other day, we briefly discussed the possibility of the market forming a double-top (12/13, 1/6 highs), but only if aggressive selling were able to clear a path lower. So far not the case."
- "The month-long consolidation now resembles a continuation-style inverse head-and-shoulders formation; marked by two declines in December and yesterday’s decline and reverse. It’s not the ‘cleanest’ looking pattern, but nevertheless one on the table. A close above the Jan 6 high would trigger the neck-line and kick off the pattern into new record territory. Based on the depth of the inverse H&S, a measured move target arrives around 2320. These continuation-style patterns many times lead to a turning point which results in a material retracement, so we'll be on the look-out for signs of a reversal should we start extending higher."
Forum on trading, automated trading systems and testing trading strategies
Sergey Golubev, 2017.01.16 09:13
3 Things to Watch in the Stock Market This Week (based on the article)
- "Stocks posted another week of gains last week. And even though the Dow Jones Industrial Average never cracked the 20,000 point level, it and the S&P 500 index ticked higher to keep firmly in rally mode."
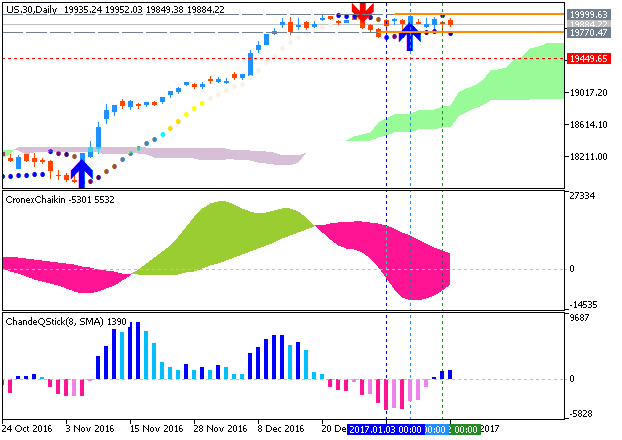
Dow Jones Industrial Average, Daily Chart: the price is testing 19,999 resistance level for the bullish trend to be continuing.
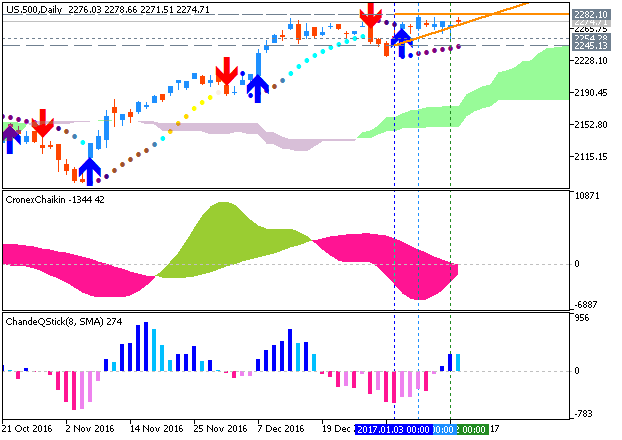
S&P 500, Daily Chart: the price is testing 2,282 resistance level for the bullish trend to be continuing.
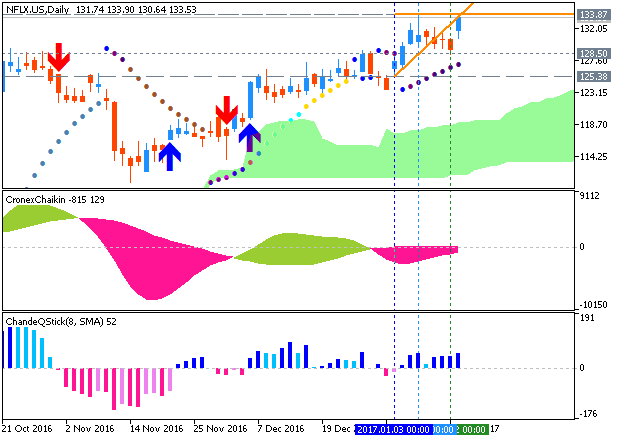
- "The week ahead could bring big portfolio swings for shareholders of Netflix, CSX, and General Electric, as the companies will post highly anticipated earnings announcements over the next few trading days."
Netflix, D1 Chart: daily share price is on bullish breakout for the testing resistance level at 133.87 to above for the bullish trend to be continuing:
Forum on trading, automated trading systems and testing trading strategies
Sergey Golubev, 2017.01.20 19:17
The major indices were each up about 0.2% as the day's ceremonies and inauguration speech were underway (based on the article)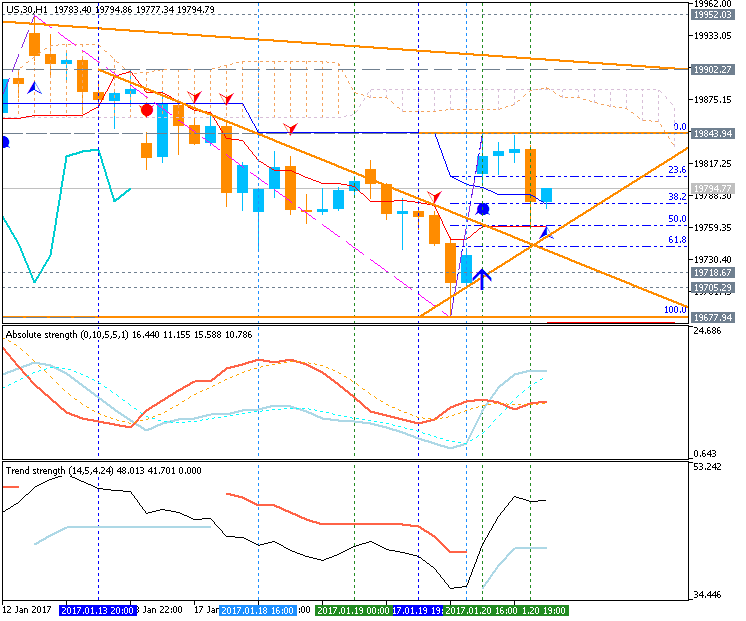
- "The major indices were each up about 0.2% as the day's ceremonies and
inauguration speech were underway. The minor gains were not enough to
push the Dow, at 19,785, above the long-awaited 20,000 level."
----------------
S&P 500 rised from 2,258 support level to above for the resistance level at 2,277 to be testing for the bullish trend to be continuing. By the way, the secondary ranging condition to be started for the price to be waiting for the directionof the trend.
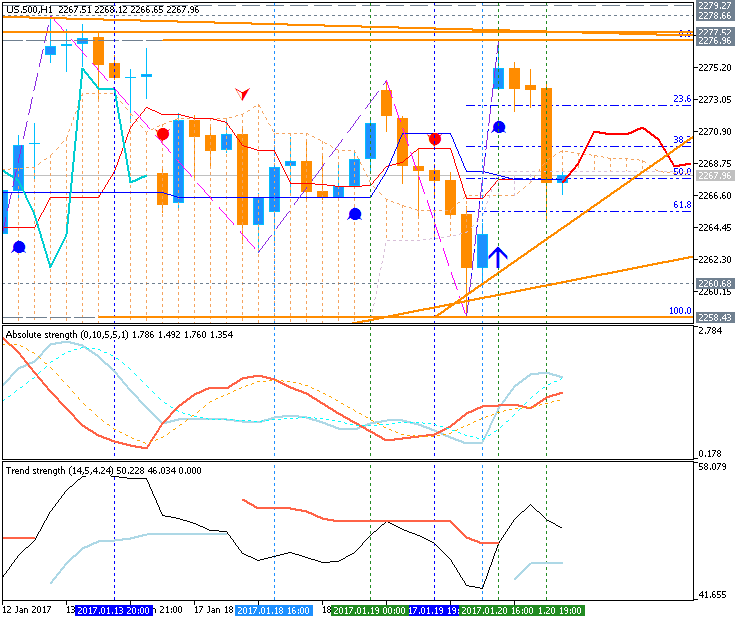
- "The stock market has enjoyed a broad-based rally since Trump was elected, with the S&P 500 adding 5% and the Dow adding 1,000 points since November. The investor excitement has been fueled by expectations that regulations will be scaled back, taxes will be lowered and fiscal spending will rise."
Forum on trading, automated trading systems and testing trading strategies
Sergey Golubev, 2017.01.23 16:11
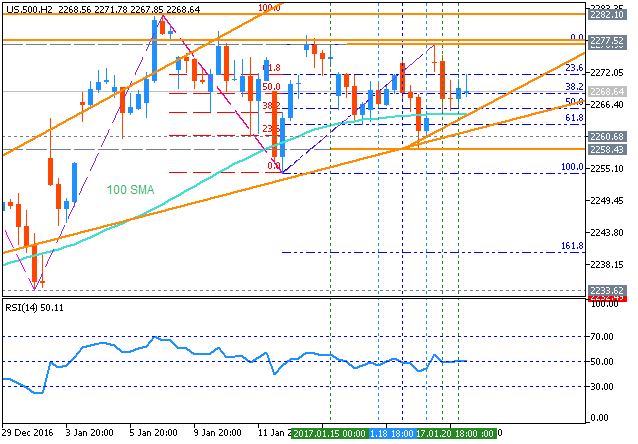
S&P 500 Intra-Day Technical Analysis: ranging for the bullish to be resumed or for the correction to be started (based on the article)
H2 price is lated far above 200 SMA with near and above 100 SMA on the border between the primary bullish trend to be resumed and the secondary bullish ranging correction to be started.
If the price breaks 2,277 resistance level to above so the bullish trend will be resumed with 2.282 resistance as the nearest bullish target to re-enter.
If the price breaks 2.258 support levelto below so the ranging correction will be started.
If not so the price will be on bullish ranging within the levels.
- "Taking it down to the 2-hr time-frame, the ‘right shoulder’ is taking form as a symmetrical triangle. It’s been under construction since the 1/6 high, finding support at the long-term trend-line which runs back to the 2007 highs. The triangle has developed enough to be considered a valid pattern, but like the inverse H&S pattern it just needs a proper trigger. The validation of both the broader H&S and triangle are in close proximity."
- "The triangle could break either way, but given the general consolidation after the power-move higher since November, it’s likely it will break in line with the continuation pattern. However, a down-side break can’t be ruled out, thus why we need to wait for confirmation, in either direction (closing bar above/below top/bottom-side trend-line). A drop below 2254 would raise red flags for the bulls, and a decline below 2248 would likely confirm that the market wants to roll over. A break through the top-side of the triangle, H&S neckline, and 2282 opens up a path towards the psychological level of 2300. The depth of the H&S formation suggests a move to around the 2320 level."
Forum on trading, automated trading systems and testing trading strategies
Sergey Golubev, 2017.01.29 08:13
Markets To Watch In The Week Ahead: The S&P 500 (based on the article)
Daily price is located far above Ichimoku cloud in the bullish area of the chart. The price is trying to cross 2,300 resistance to above for the bullish trend to be continuing. Alternative, if the price breaks 2,282/2,277 support levels to below so the secondary correction within the primary bullish trend will be started.

- "The S&P 500 advance/decline line broke out ahead of prices as it had been in a solid uptrend since early December, line c. A strong close this week will suggest prices are ready to accelerate on the upside. The weekly A/D line has also made a new high."
Forum on trading, automated trading systems and testing trading strategies
Sergey Golubev, 2017.02.03 16:42
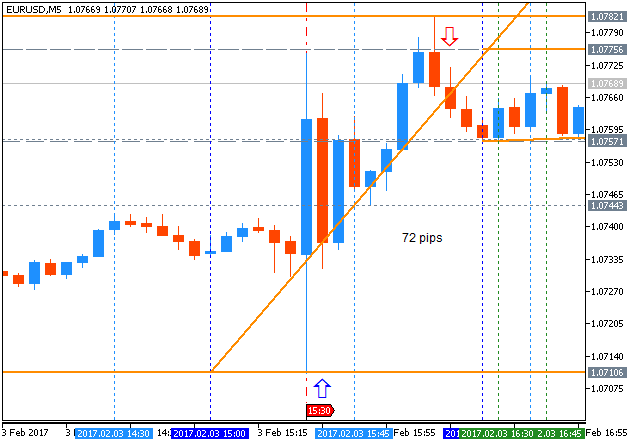
Intra-Day Fundamentals - EUR/USD, Dollar Index and S&P 500: Non-Farm Payrolls
2017-02-03 13:30 GMT | [USD -Non-Farm Employment Change]
- past data is 157K
- forecast data is 170K
- actual data is 227K according to the latest press release
if actual > forecast (or previous one) = good for currency (for USD in our case)
[USD -Non-Farm Employment Change] = Change in the number of employed people during the previous month, excluding the farming industry.
==========
From official report:
- "Total nonfarm payroll employment increased by 227,000 in January, and the unemployment rate was little changed at 4.8 percent, the U.S. Bureau of Labor Statistics reported today. Job gains occurred in retail trade, construction, and financial activities."
==========
EUR/USD M5: 72 pips range price movement by Non-Farm Payrolls news events
==========
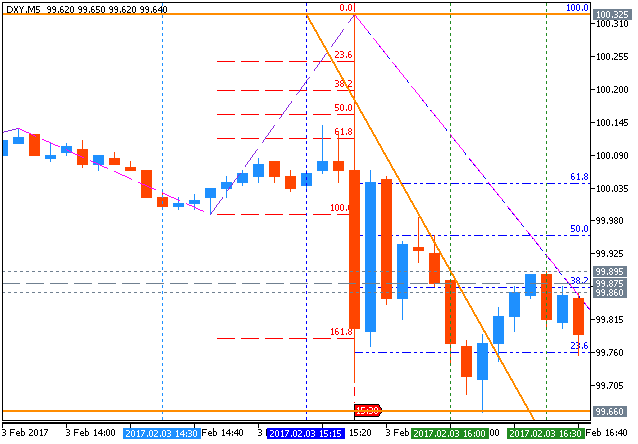
Dollar Index M5: range price movement by Non-Farm Payrolls news events
==========
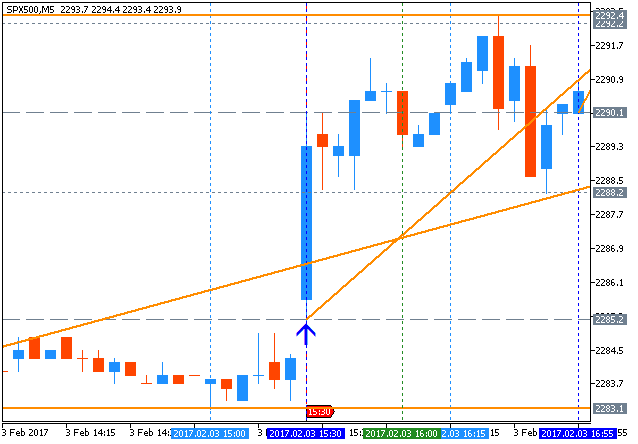
S&P 500 M5: range price movement by Non-Farm Payrolls news events
- Free trading apps
- Over 8,000 signals for copying
- Economic news for exploring financial markets
You agree to website policy and terms of use
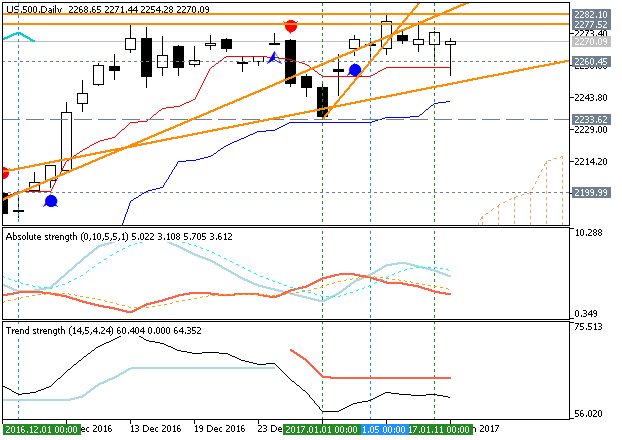
S&P 500 January-March 2017 Forecast: long-term bullish ranging within the narrow s/r levels for direction
W1 price is located far above Ichimoku cloud in the bullish area of the chart. The price is on ranging within the following narrow support/resistance levels for the bullish trend to be resumed or for the secondary correction to be started:
- 2,277.52 resistance level located above Ichimoku cloud in the bullish trend to be resumed, and
- 2,214.10 support level located in the beginning of the correction to be started.
Chinkou Span line is located above the price indicating the ranging condition, Trend Strength indicator is estimating the trend as the primary bullish, and Absolute Strength indicator is evaluating the trend as the secondary ranging market condition. Tenkan-sen line is near and above Kijun-sen line for the ranging bullish trend.Trend:
W1 - bullish