Join our fan page
- Views:
- 8235
- Rating:
- Published:
- Updated:
-
Need a robot or indicator based on this code? Order it on Freelance Go to Freelance
Real author:
Ivan Kornilov
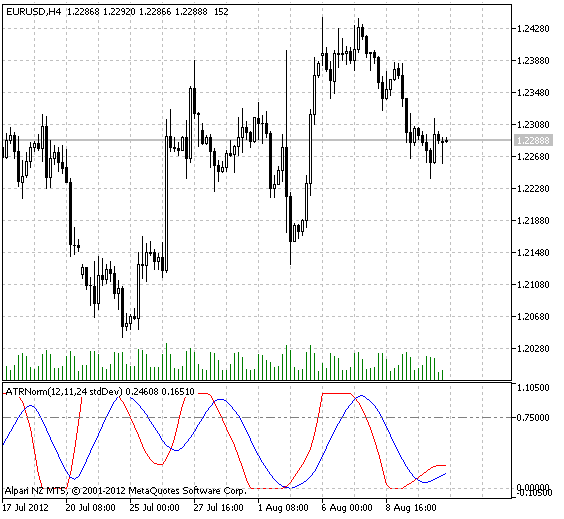
ATRNorm is the normalized version of Average True Range. The indicator can also normalize tick volume, standard deviation, etc. using ValueType input parameter. ATRNorm has been created to detect flat areas.
This indicator was first implemented in MQL4 and published in Code Base 10.05.2012 (in Russian).
The indicator uses SmoothAlgorithms.mqh library classes (must be copied to the terminal_data_folder\MQL5\Include). The use of the classes was thoroughly described in the article "Averaging Price Series for Intermediate Calculations Without Using Additional Buffers".
Indicator input parameters:
//+----------------------------------------------+
//| Indicator input parameters                   |
//+----------------------------------------------+
input uint period=12;                             // Indicator period
input uint ma=12;                                 // Smoothing period
input IndType ValueType=ATR;                      // Normalized indicator type
input uint normLimit=24;                          // Normalizing period
input ENUM_APPLIED_VOLUME VolumeType=VOLUME_TICK; // Volume
input int Shift=0;                                // Horizontal shift of the indicator in bars

Translated from Russian by MetaQuotes Ltd.
Original code: https://www.mql5.com/ru/code/971
 MARSICD
Trend indicator based on two RSI oscillators.
 MA_NRTR
Simple trend indicator in the form of NRTR
 MACD Elder Impulse Max
MACD histogram with bars coloring according to Elder Impulse System.
 BullsBears
The trend indicator in the form of a colored cloud using volumes in its calculations. Enhanced version of Bears and Bulls indicator. The idea is to reveal the first market impulse and estimate its duration.