Join our fan page
- Views:
- 11130
- Rating:
- Published:
- Updated:
-
Need a robot or indicator based on this code? Order it on Freelance Go to Freelance
In order to determine a trend stability J. Welles Wilder developed Average Directional Index (ADX).
ADX allows to analyze market trends and make trading decisions, including FOREX market.
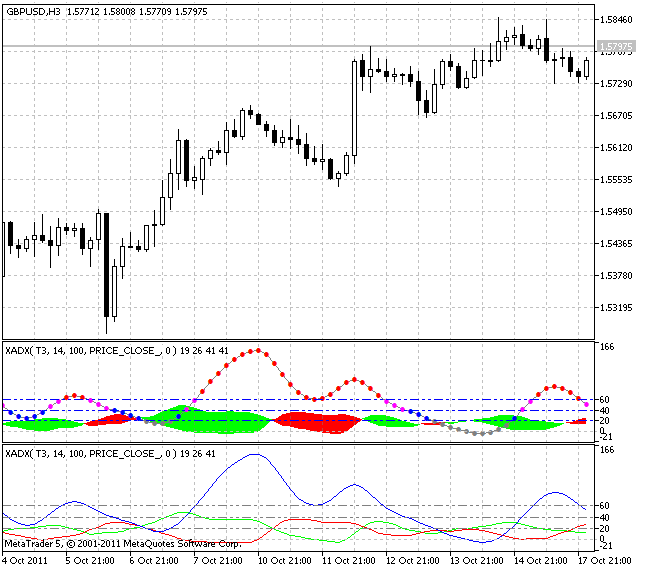
However, the look of this indicator leaves a lot to be desired - it is not visually convenient.
To improve that ColorXADX.mq5 indicator code has been created, in which +DI and -DI lines are displayed in DRAW_FILLING style with the color that changes depending on the current trend direction and cloud width proportional to the trend power. ADX line is made in the form of dots. Their color depends on the trend power defined by location of these dots relative to the levels, the values of which are assigned in settings.
The indicators are built with the use of universal smoothing with two averagings and a possibility to select each of these averagings from the dozen of possible versions:
- SMA - simple moving average;
- EMA - exponential moving average;
- SMMA - smoothed moving average;
- LWMA - linear weighted moving average;
- JJMA - JMA adaptive average;
- JurX - ultralinear smoothing;
- ParMA - parabolic smoothing;
- T3 - Tillson's multiple exponential smoothing;
- VIDYA - smoothing with the use of Tushar Chande's algorithm;
- AMA - smoothing with the use of Perry Kaufman's algorithm.
It should be noted that Phase parameter has completely different meaning for different smoothing algorithms.
- For JMA it is an external Phase variable changing from -100 to +100.
- For T3 it is a smoothing ratio multiplied by 100 for better visualization;
- For VIDYA it is a CMO period, for AMA it is a slow EMA period;
- For AMA fast EMA period is a fixed value and is equal to 2 by default. The ratio of raising to the power is also equal to 2 for AMA.
The indicators use SmoothAlgorithms.mqh library classes (must be copied to the terminal_data_folder\MQL5\Include). The use of the classes was thoroughly described in the article "Averaging Price Series for Intermediate Calculations Without Using Additional Buffers".

ColorXADX indicator input parameters:
//+----------------------------------------------+
//| Indicator input parameters                   |
//+----------------------------------------------+
input Smooth_Method XMA_Method=MODE_T3;         // Histogram smoothing method
input int ADX_Period =14;                        // XMA smoothing period
input int ADX_Phase=100;                         // XMA smoothing period [-100...+100]
input Applied_price_ IPC=PRICE_CLOSE_;          // Applied price
input int Shift=0;                               // Horizontal shift of the indicator in bars
input int ExtraHighLevel=60;                     // Maximum trend level
input int HighLevel=40;                          // Strong trend level
input int LowLevel=20;                           // Weak trend level
input ENUM_LINE_STYLE LevelStyle=STYLE_DASHDOTDOT;  // Levels lines style
input color LevelColor=Blue;                     // Levels color
input ENUM_WIDTH LevelWidth=w_1;                // Levels width
Translated from Russian by MetaQuotes Ltd.
Original code: https://www.mql5.com/ru/code/586
 XMA JJRSX System
The indicator is based on comparing the signals of JJRSX oscillator and XMA moving average working on different timeframes - the current (chart timeframe) and the higher ones.
 JFatlAcceleration_HTF
This indicator shows the direction of the acceleration of JFatlAcceleration price from a larger timeframe at a smaller one.
 LinearRegSlope V2
Moving average with the linear regression algorithm.
 Laguerre Filter
The indicator consisting of two moving averages from John Ehlers' book "Cybernetic Analysis for Stocks and Futures: Cutting-Edge DSP Technology to Improve Your Trading".