Join our fan page
- Views:
- 7647
- Rating:
- Published:
- Updated:
-
Need a robot or indicator based on this code? Order it on Freelance Go to Freelance
Real author:
Raff
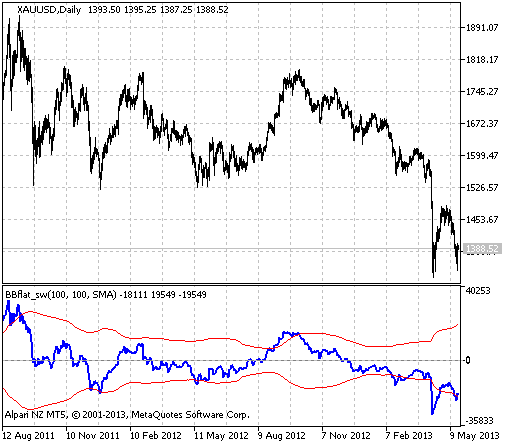
A simple interpretation of the Bollinger Bands indicator in a separate window.
Indicator input parameters:
//+-----------------------------------+
//| Indicator input parameters        |
//+-----------------------------------+
input Smooth_Method XMA_Method=MODE_SMA; // Method of averaging
input int XLength=100;                   // Depth of averaging
input int XPhase=15;                     // Parameter of averaging
input int BandsPeriod=100;               // Period of BB averaging
input double BandsDeviation = 2.0;       // Deviation
input Applied_price_ IPC=PRICE_CLOSE;    // Price constant
input int Shift=0;                       // Horizontal shift of the indicator in bars
This indicator was first implemented in MQL4 and published in Code Base on 07.05.2008.
The indicator uses SmoothAlgorithms.mqh library classes (must be copied to the terminal_data_folder\MQL5\Include). The use of the classes was thoroughly described in the article "Averaging Price Series for Intermediate Calculations Without Using Additional Buffers".

Figure 1. The BBflat_sw indicator
Translated from Russian by MetaQuotes Ltd.
Original code: https://www.mql5.com/ru/code/1729
 Cronex_Impulse_CD_Color
A modification of the MACD histogram.
 A WPR Based Trailing Stop Module
A trailing stop module based on the WPR indicator with short and long Stop Loss
 RSICandle
The RSI indicator implemented as a sequence of candlesticks
 FX5_SelfAdjustingRSI
The RSI oscillator with the boundaries of the overbought/oversold areas expressed by Bollinger Bands