
This article is for informational and educational purposes only. It does not constitute financial advice or an investment recommendation. Trading in financial markets carries a high risk of loss.
Introduction
Whether you are about to buy an Expert Advisor, test one of your own or decide whether to trust a result, the backtest is usually the first thing you look at. It is a very useful tool, as long as you know what it can show and what it cannot. A good-looking equity curve is the easiest part to obtain, and the least informative on its own.
This is the first article in a series on evaluating an Expert Advisor. It is divided into three sections. The first explains what a backtest can tell you and which data to look at first. The second shows how to recognise a fragile result. The third covers what no backtest can show and how to read a backtest published by someone else.
1. What a backtest can tell you
Start with the strategy, not the curve
Before reading any number, you need to know what the EA does: in which conditions it enters, how it exits, how it manages risk and which parameters control each part. A trend-following EA, a range strategy and a grid system can produce similar curves for completely different reasons, and they fail in different ways.
A simple test: if you cannot explain in two or three sentences when the EA opens and closes a trade, you cannot judge its backtest, and later you will not be able to tell whether it has stopped working.
The data to look at first
The MetaTrader 5 Strategy Tester report contains many figures. These are the ones that say the most about an EA:
| Figure in the report | What it tells you | Warning sign |
|---|---|---|
| Total trades | How much evidence the result is based on | Fewer than about 100 trades |
| Expected Payoff | Average result per trade after the costs applied | Close to the spread and commission of one trade |
| Profit Factor | Gross profit divided by gross loss | Very high values with few trades |
| Equity Drawdown Maximal | The worst fall, including open losses | Much larger than the balance drawdown |
| Maximum consecutive losses | The longest losing streak you would have lived through | A streak you would not tolerate in live trading |
| History Quality | How complete the price data used was | Low percentages, especially on tick-based tests |
Indicative thresholds. What is acceptable depends on the strategy, the timeframe and your own risk tolerance.
The drawdown and the losing streaks are covered in detail in the article on drawdown and recovery, and the relation between win rate and payoff in the article on risk/reward and win rate.
Why the number of trades matters so much
Every figure in a backtest is an estimate, and its precision depends on the number of trades. With few trades, a strategy can look excellent by pure chance.
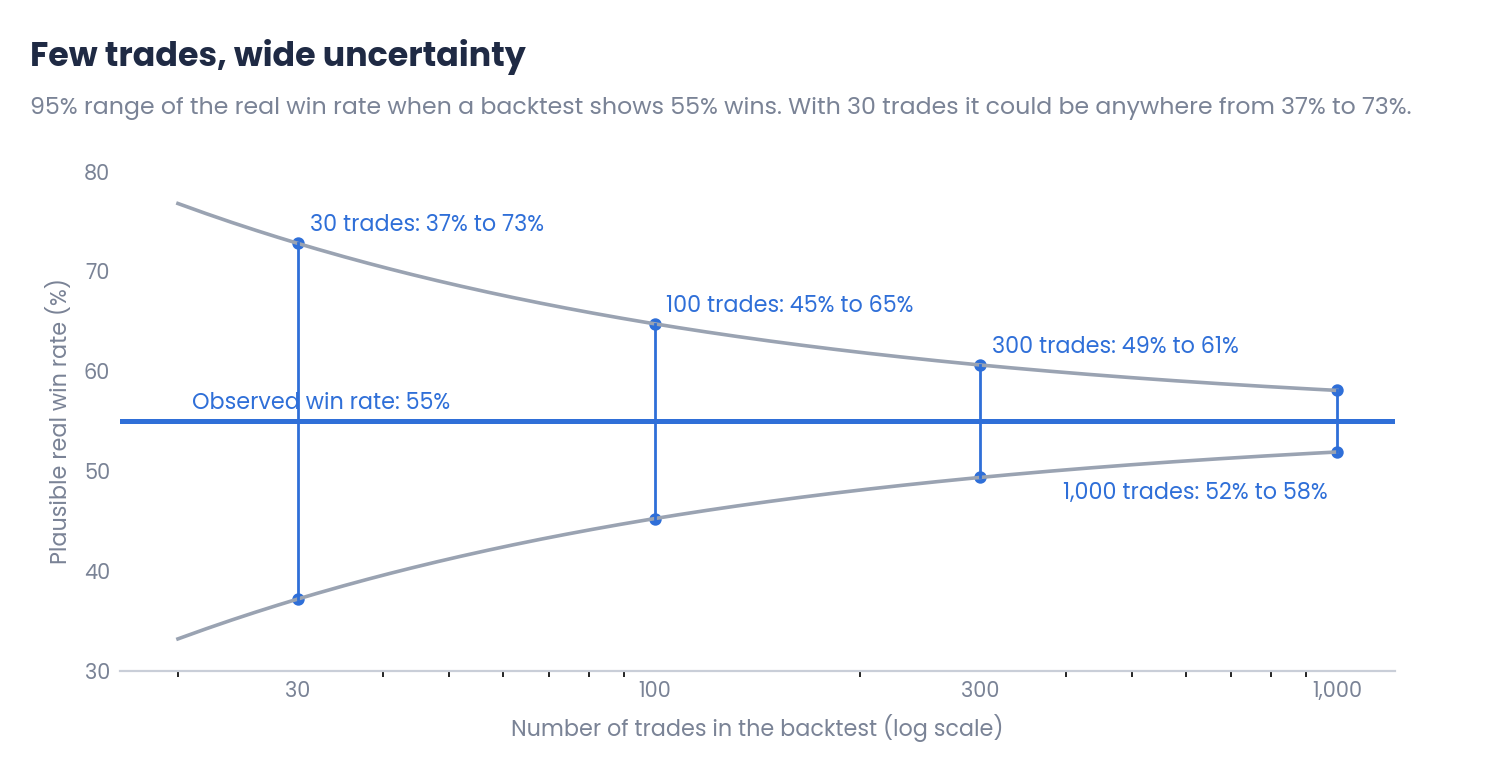
Figure 1. Plausible range of the real win rate for a backtest showing 55% wins
With 30 trades, a 55% win rate is compatible with a real win rate anywhere between 37% and 73%, which can mean a very profitable strategy or a losing one. With 300 trades the range narrows to 49% to 61%, and with 1,000 trades to 52% to 58%. The same applies to the profit factor and the expected payoff.
2. How to recognise a fragile backtest
Less is more: parameters and filters
Every parameter and every filter added to an EA gives the optimisation more freedom to fit the past. With enough of them, almost any history can be turned into a beautiful curve. That curve describes the past very well and the future very poorly.
An EA with few parameters and simple rules has fewer ways to fit noise. If two versions of a strategy give similar results, the simpler one is usually the more reliable.
Look for a plateau, not a peak
After an optimisation, it is not enough to look at the best result. What matters is what happens around it.
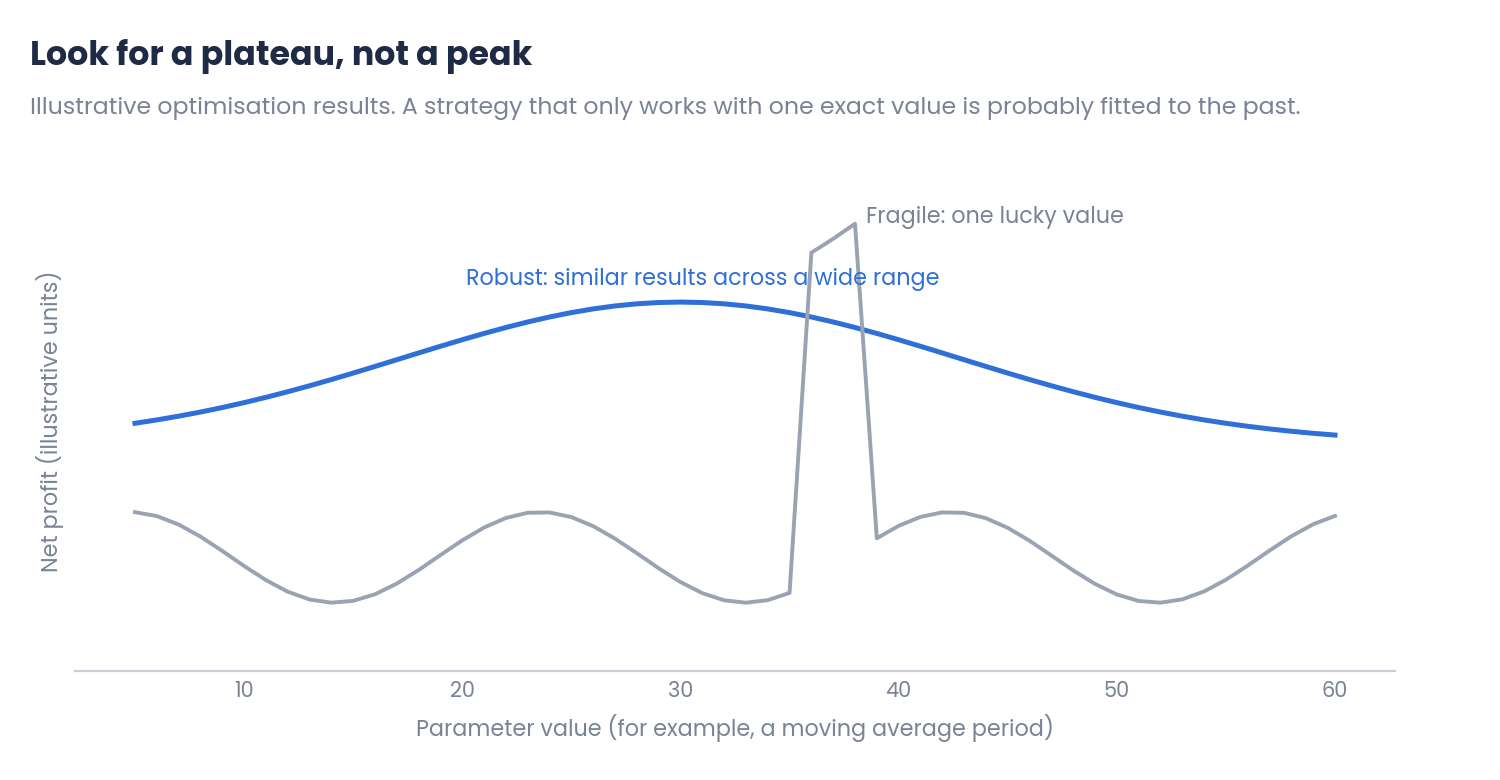
Figure 2. A robust parameter versus a fragile one (illustrative)
If the strategy works with a period of 30 but also with 25 and 35, the result is probably capturing something real. If it only works with 37 and fails with 36 and 38, the optimisation has found a lucky value. The optimisation graphs in the Strategy Tester help to see this at a glance.
Test outside the optimised period
A result obtained on the same data used to choose the parameters will always look better than it really is. The Strategy Tester's Forward option reserves part of the period, for example the last third, which is not used to optimise. If the EA keeps a similar behaviour on that unseen data, the result is more credible.
It also helps to look at the results year by year. A strategy whose profit comes almost entirely from one exceptional year depends on conditions that may not repeat.
When the balance curve hides the risk
The balance curve only changes when trades are closed. If an EA keeps losing positions open until they recover, the balance can rise smoothly while the account goes through deep drawdowns.
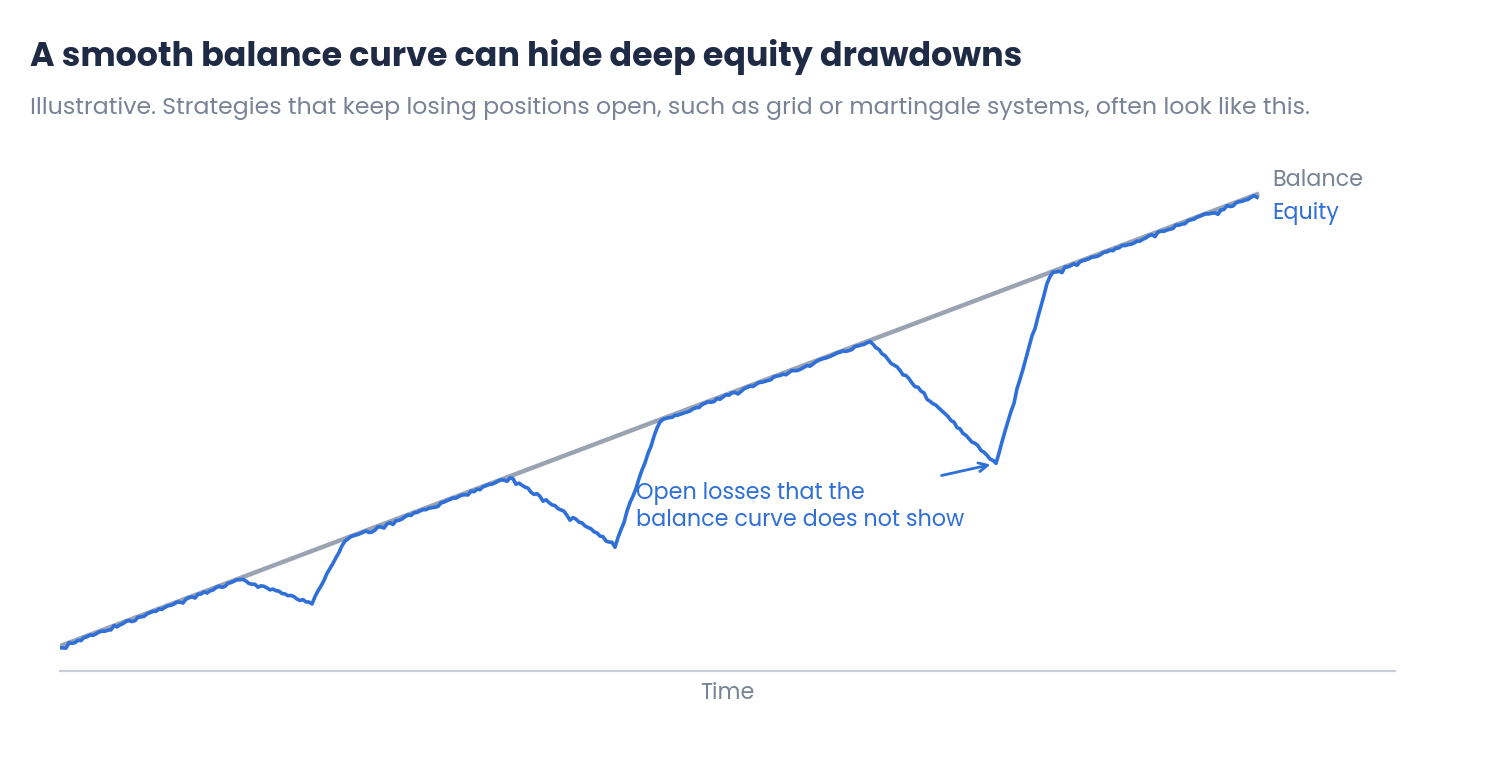
Figure 3. Balance and equity of a strategy that holds losing positions (illustrative)
Very high win rates, long series without losing trades and a large gap between balance drawdown and equity drawdown are typical of grid and martingale systems. They can work for a long time, but the risk is concentrated in a few events that can be very damaging.
3. What a backtest cannot tell you
The limits of any backtest
- The future: a backtest shows how the rules behaved in past conditions. Markets change, and a strategy can stop working without any error in its code.
- Real execution: slippage, requotes, latency and spread spikes are only partly simulated, even with real ticks.
- Your broker's conditions: a test with another broker's data, spreads or swaps may not apply to your account. The article on hidden costs in backtests explains what the tester includes and what it does not.
- Your reaction: a 25% drawdown is a number in a report. Living through it with real money is different, and many traders switch off an EA at the worst moment.
Reading a backtest published by someone else
When you evaluate an EA before buying it, the backtest is usually provided by the seller. These questions help to read it with criteria:
| Question | Why it matters |
|---|---|
| 1. Which modelling mode and data were used? | Tests on open prices or with low history quality can be very optimistic |
| 2. How long is the period and how many trades are there? | A few months or a few dozen trades say very little |
| 3. Are spread, commission and swap realistic? | Costs can turn a small edge into a loss |
| 4. How large is the equity drawdown? | It shows the risk the balance curve may hide |
| 5. Is there a forward period or a live signal? | Results on unseen data are much more credible |
| 6. Can you repeat the test yourself? | A free demo version lets you test it with your own broker's data |
No single answer decides whether an EA is good. Together, they show how much the backtest can be trusted.
Common mistakes
- Judging by the curve. A smooth curve says nothing without the number of trades, the costs and the equity drawdown.
- Trusting the best optimisation result. Without stable neighbouring values, it is probably a fit to the past.
- Using an EA you do not understand. Without knowing its logic, it is impossible to interpret its results or its failures.
- Treating the backtest as a promise. It only describes the past.
Conclusions
- What a backtest can tell you: how the rules behaved in the past, their risk profile and their sensitivity to costs. Start by understanding the strategy, and give priority to the number of trades, the expected payoff, the equity drawdown and the losing streaks.
- How to recognise a fragile result: many parameters, isolated optimisation peaks, results concentrated in one period and a large gap between balance and equity. Less is more: simple rules that work across a range of values are more reliable.
- What it cannot tell you: the future, real execution, your broker's conditions and how you will react to a drawdown. When the backtest comes from someone else, check how it was made and repeat it yourself if you can.
A backtest is where an evaluation starts. The next article in this series covers how to choose the risk and capital for an EA based on what the backtest shows. Test any EA with your own data on demo or in the Strategy Tester, and combine it with disciplined risk management.
References
- MetaTrader 5 Help: Strategy Tester, optimisation, forward testing and the testing report.
- Robert Pardo, The Evaluation and Optimization of Trading Strategies, 2nd edition, 2008.
Disclaimer
This content is for informational and educational purposes only. It does not constitute financial advice or a recommendation to buy or sell any instrument or product. Backtest results are not a forecast. The charts and examples are illustrative, and every asset, strategy and broker is different. Trading forex, CFDs and other leveraged products carries a high risk of loss. Every trading decision, and its outcome, is the sole responsibility of the reader. The author accepts no liability for any loss arising from the use of this information.




